Build a Drag and Drop Dashboard Builder With AI and No-Code
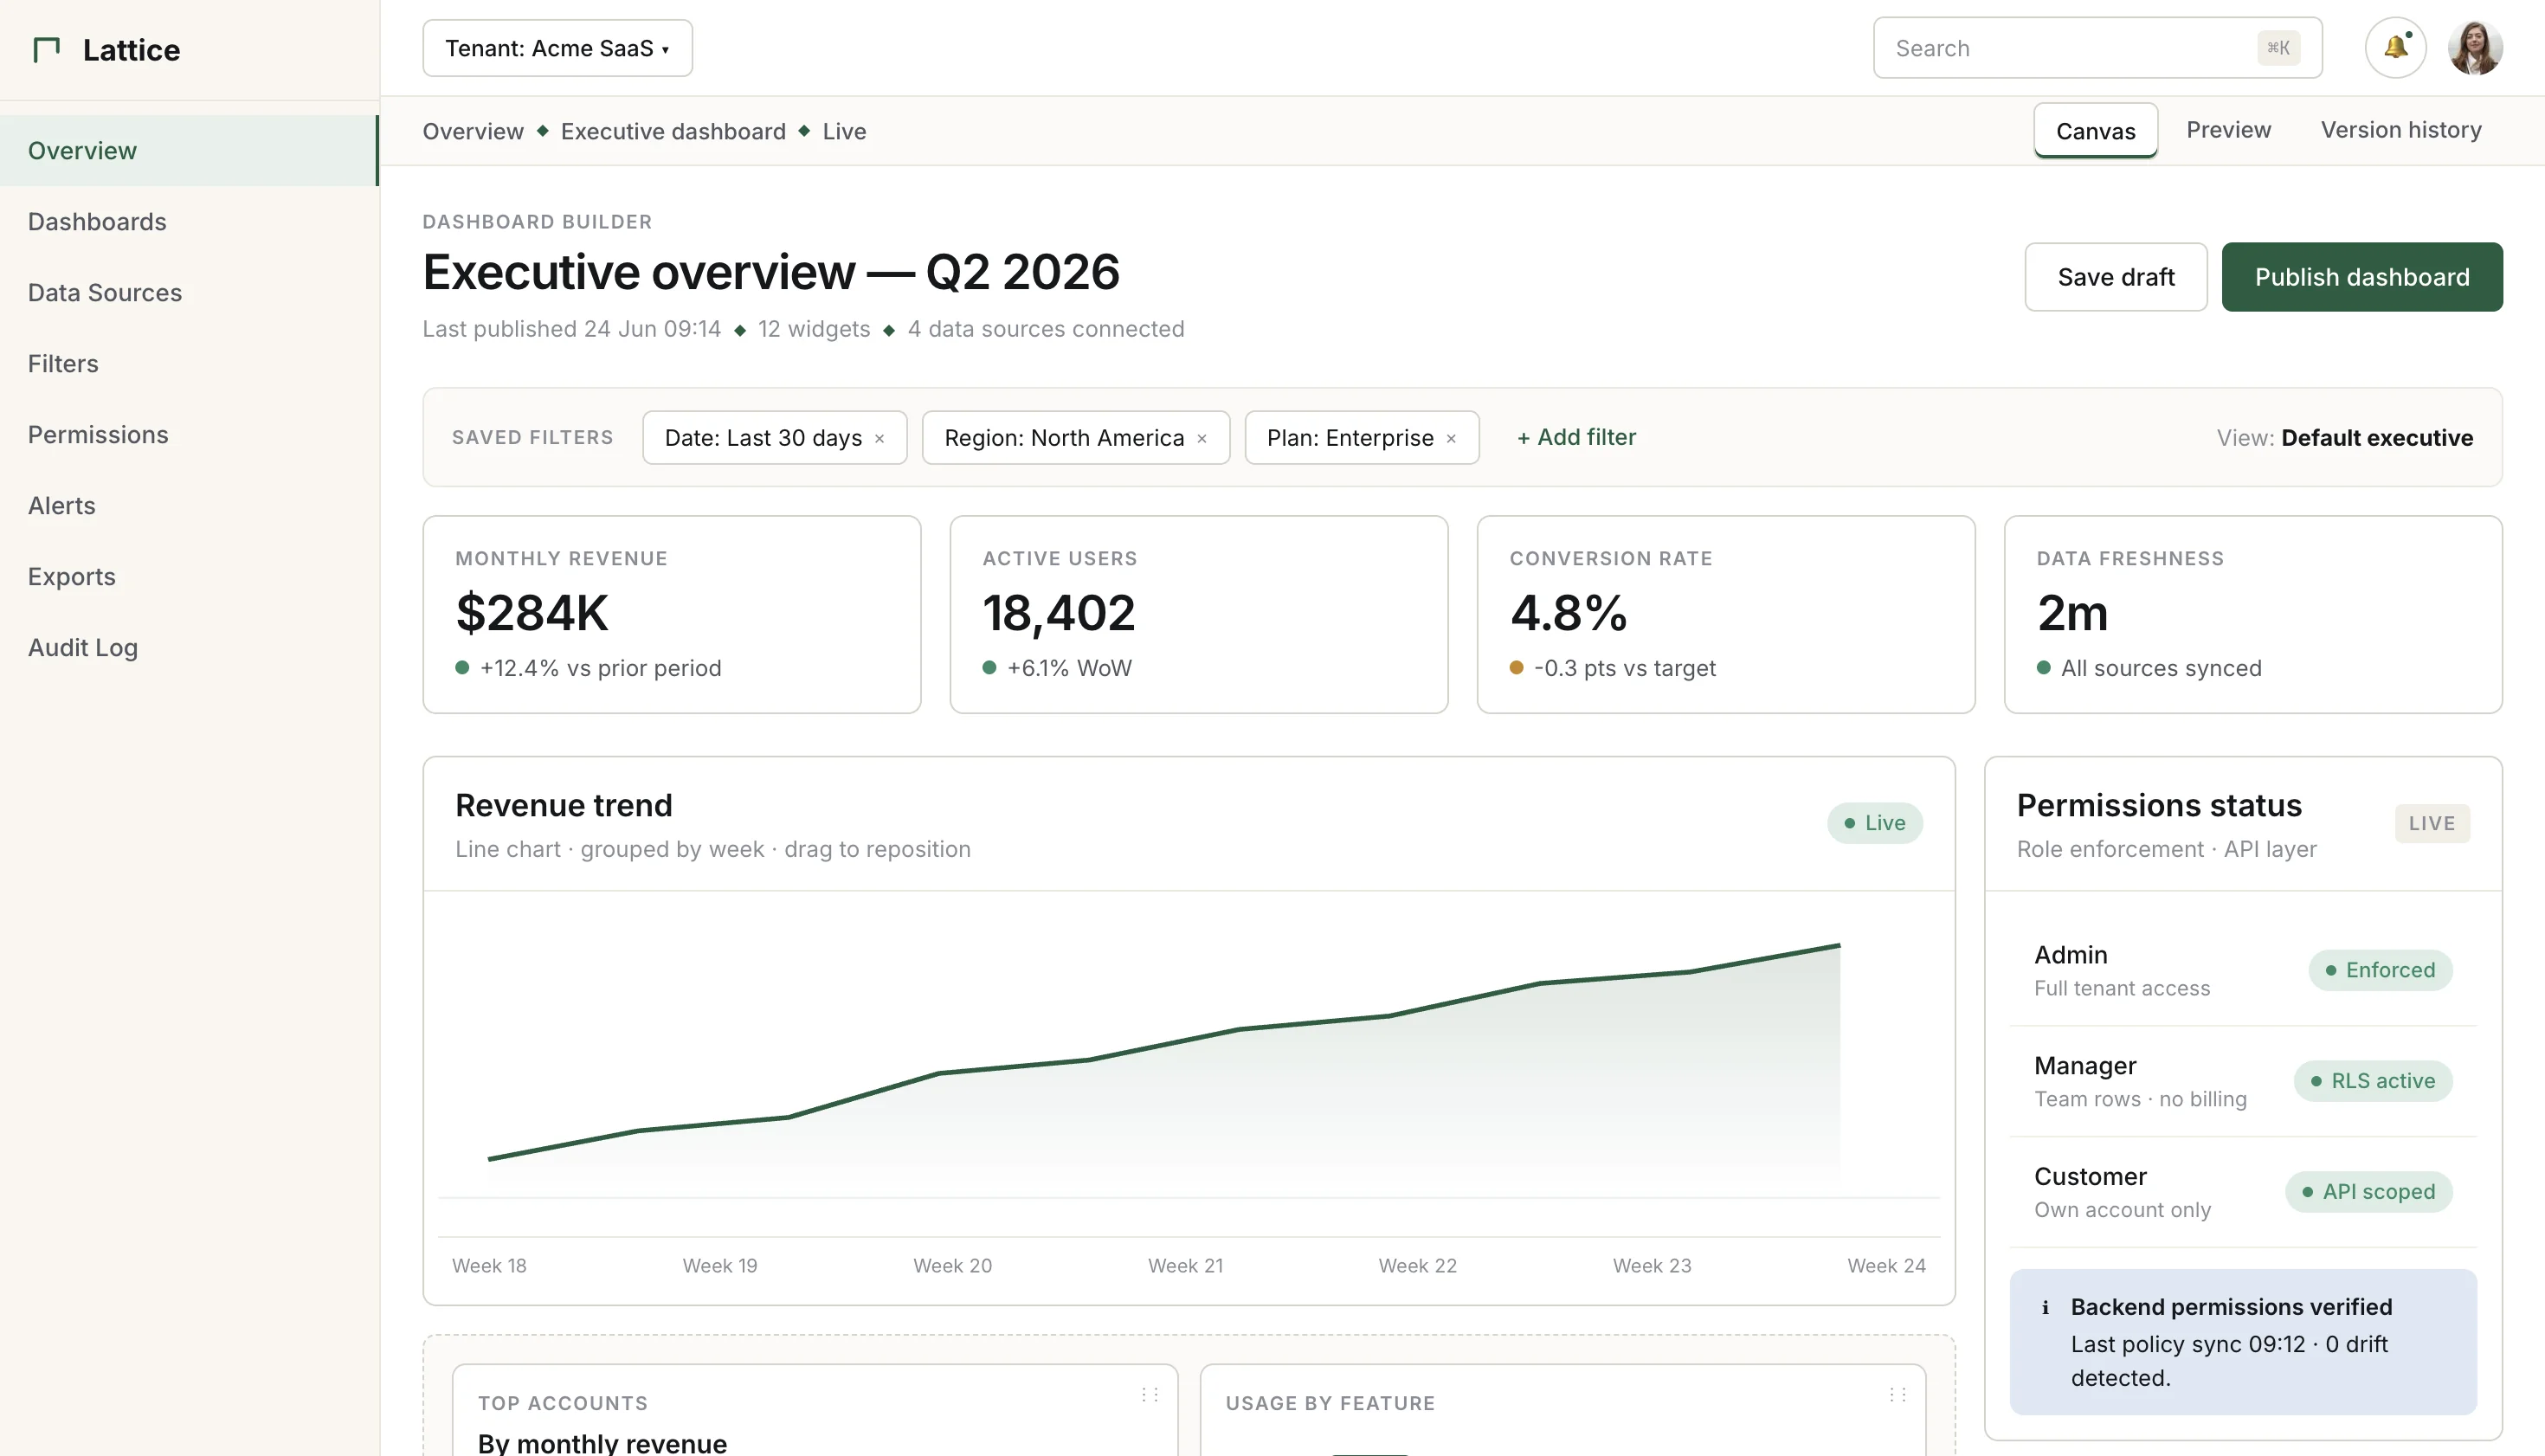
Dashboards are easy to start and hard to make product-ready. WeWeb helps you build KPI views, analytics portals, customer dashboards, and reporting tools with visual design, AI assistance, backend data, and secure permissions.

Trusted by founders & Fortune 500s
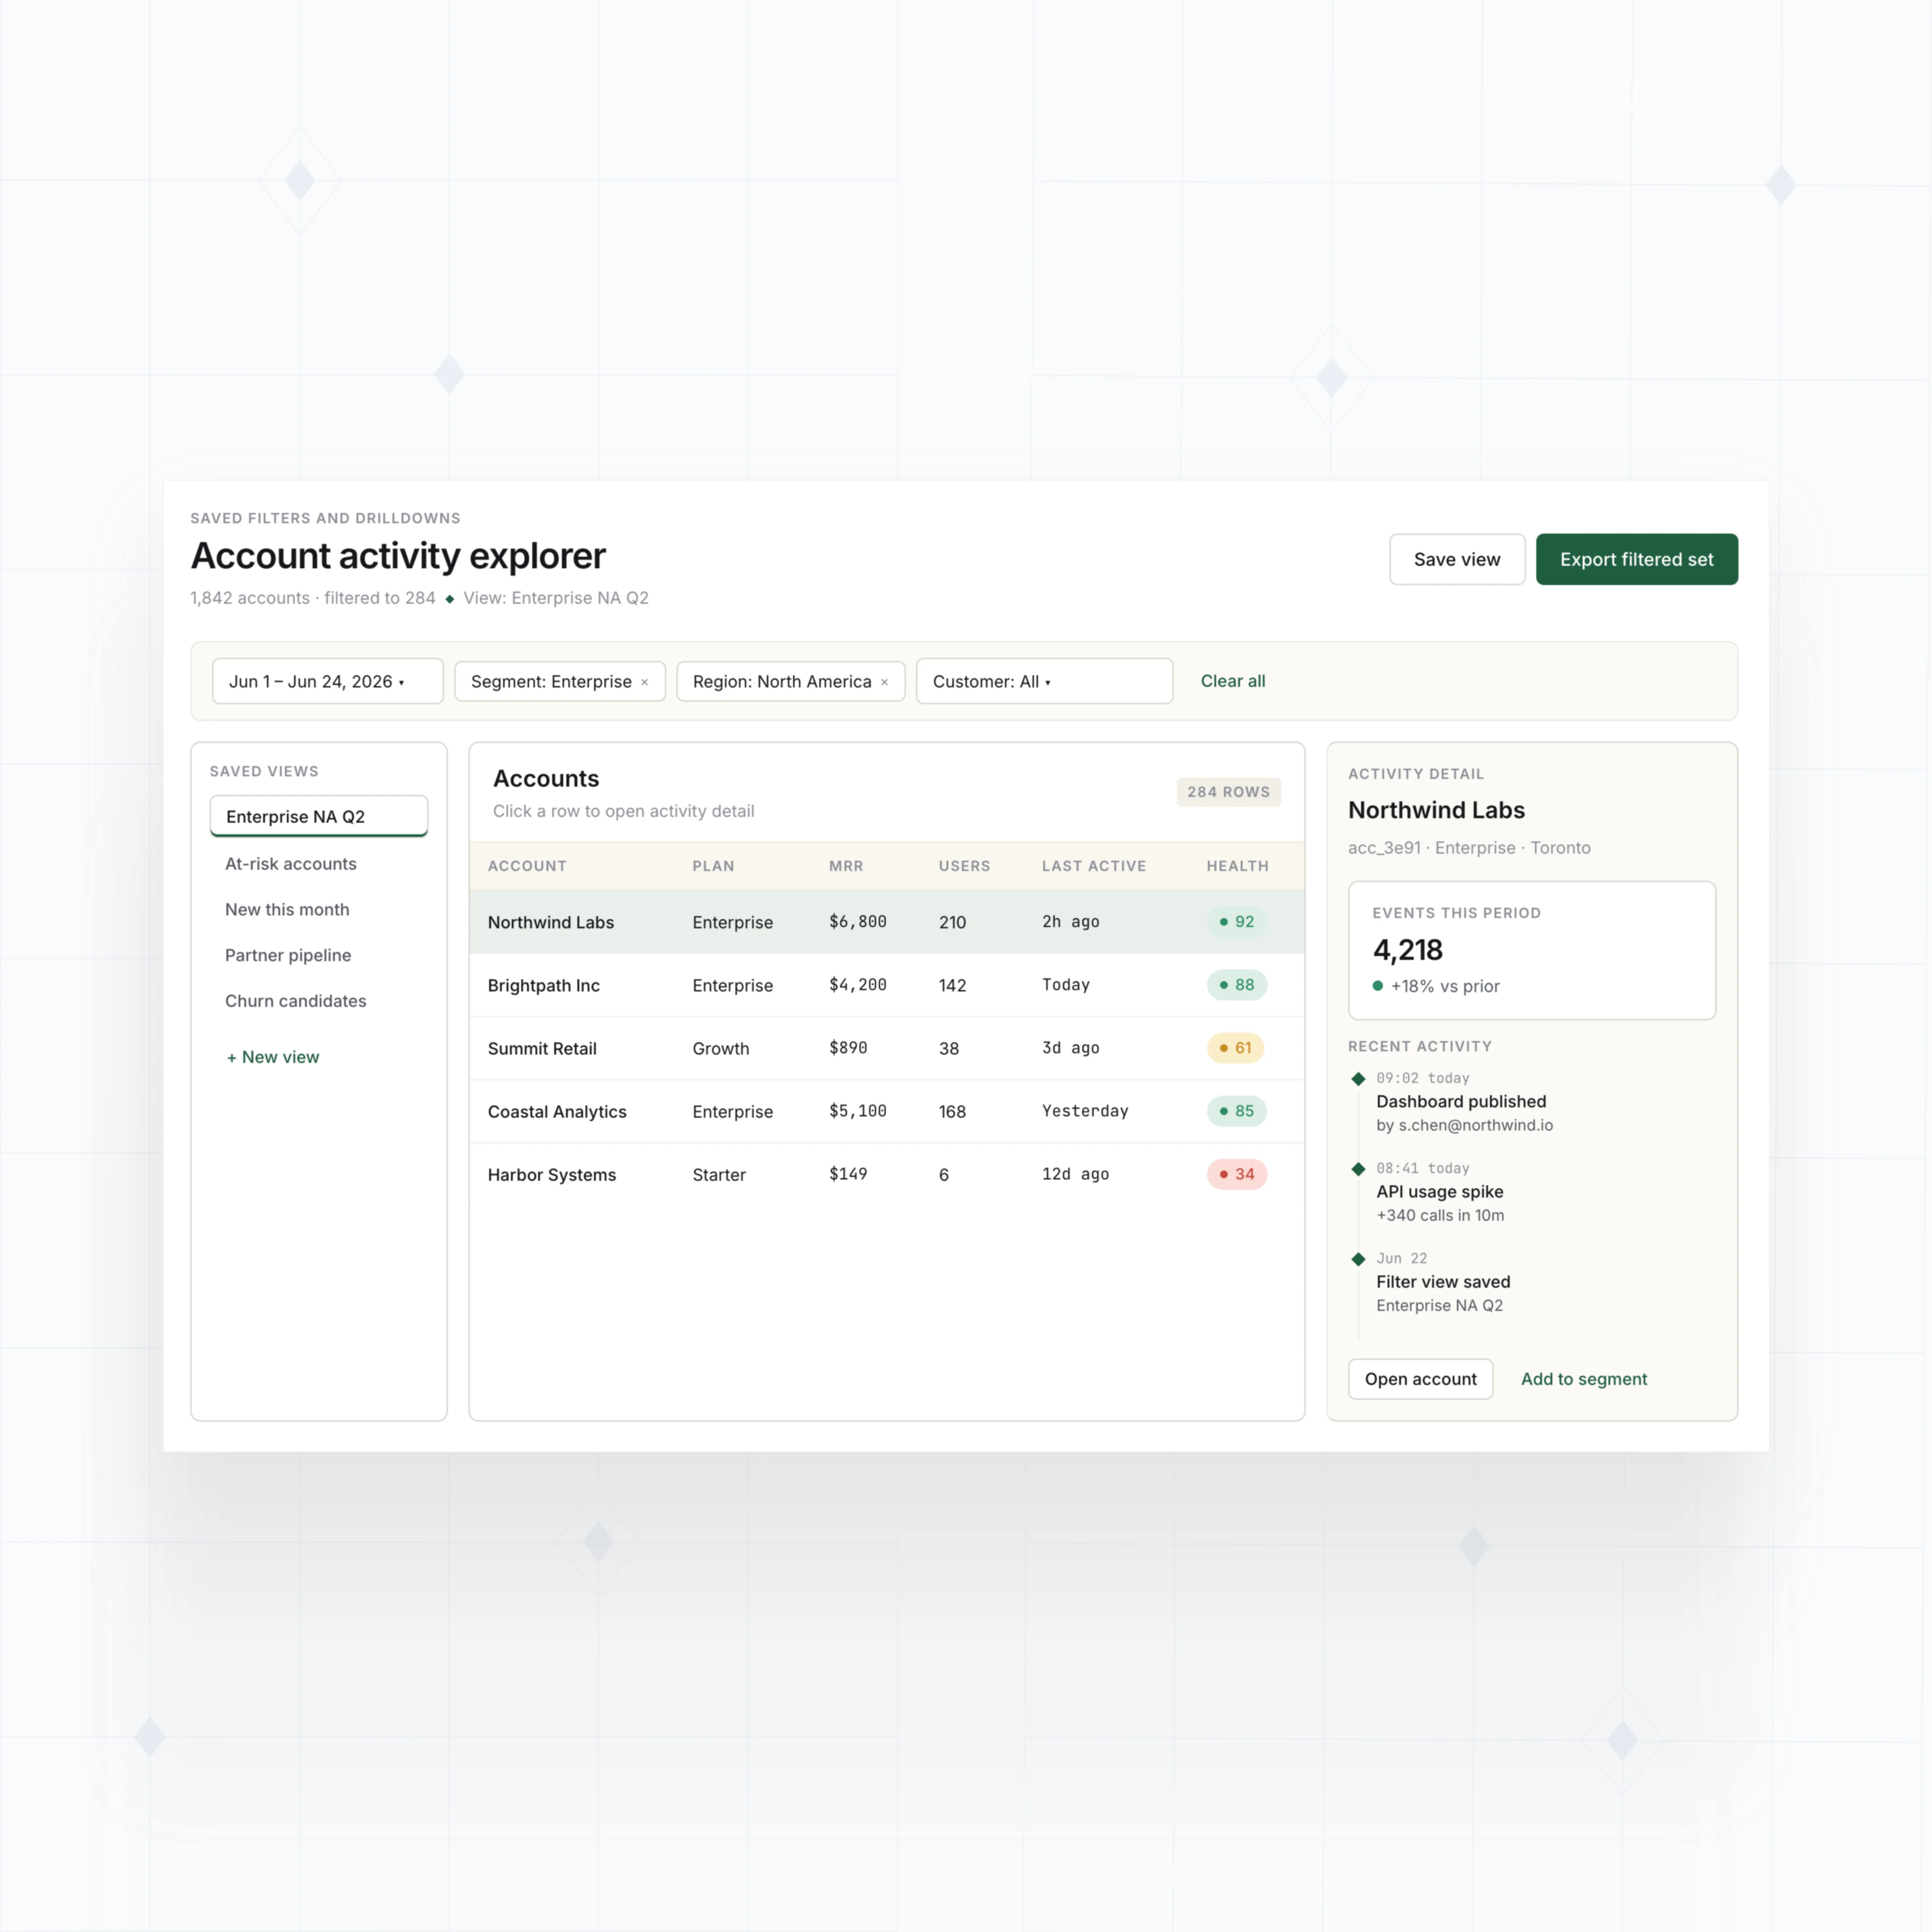
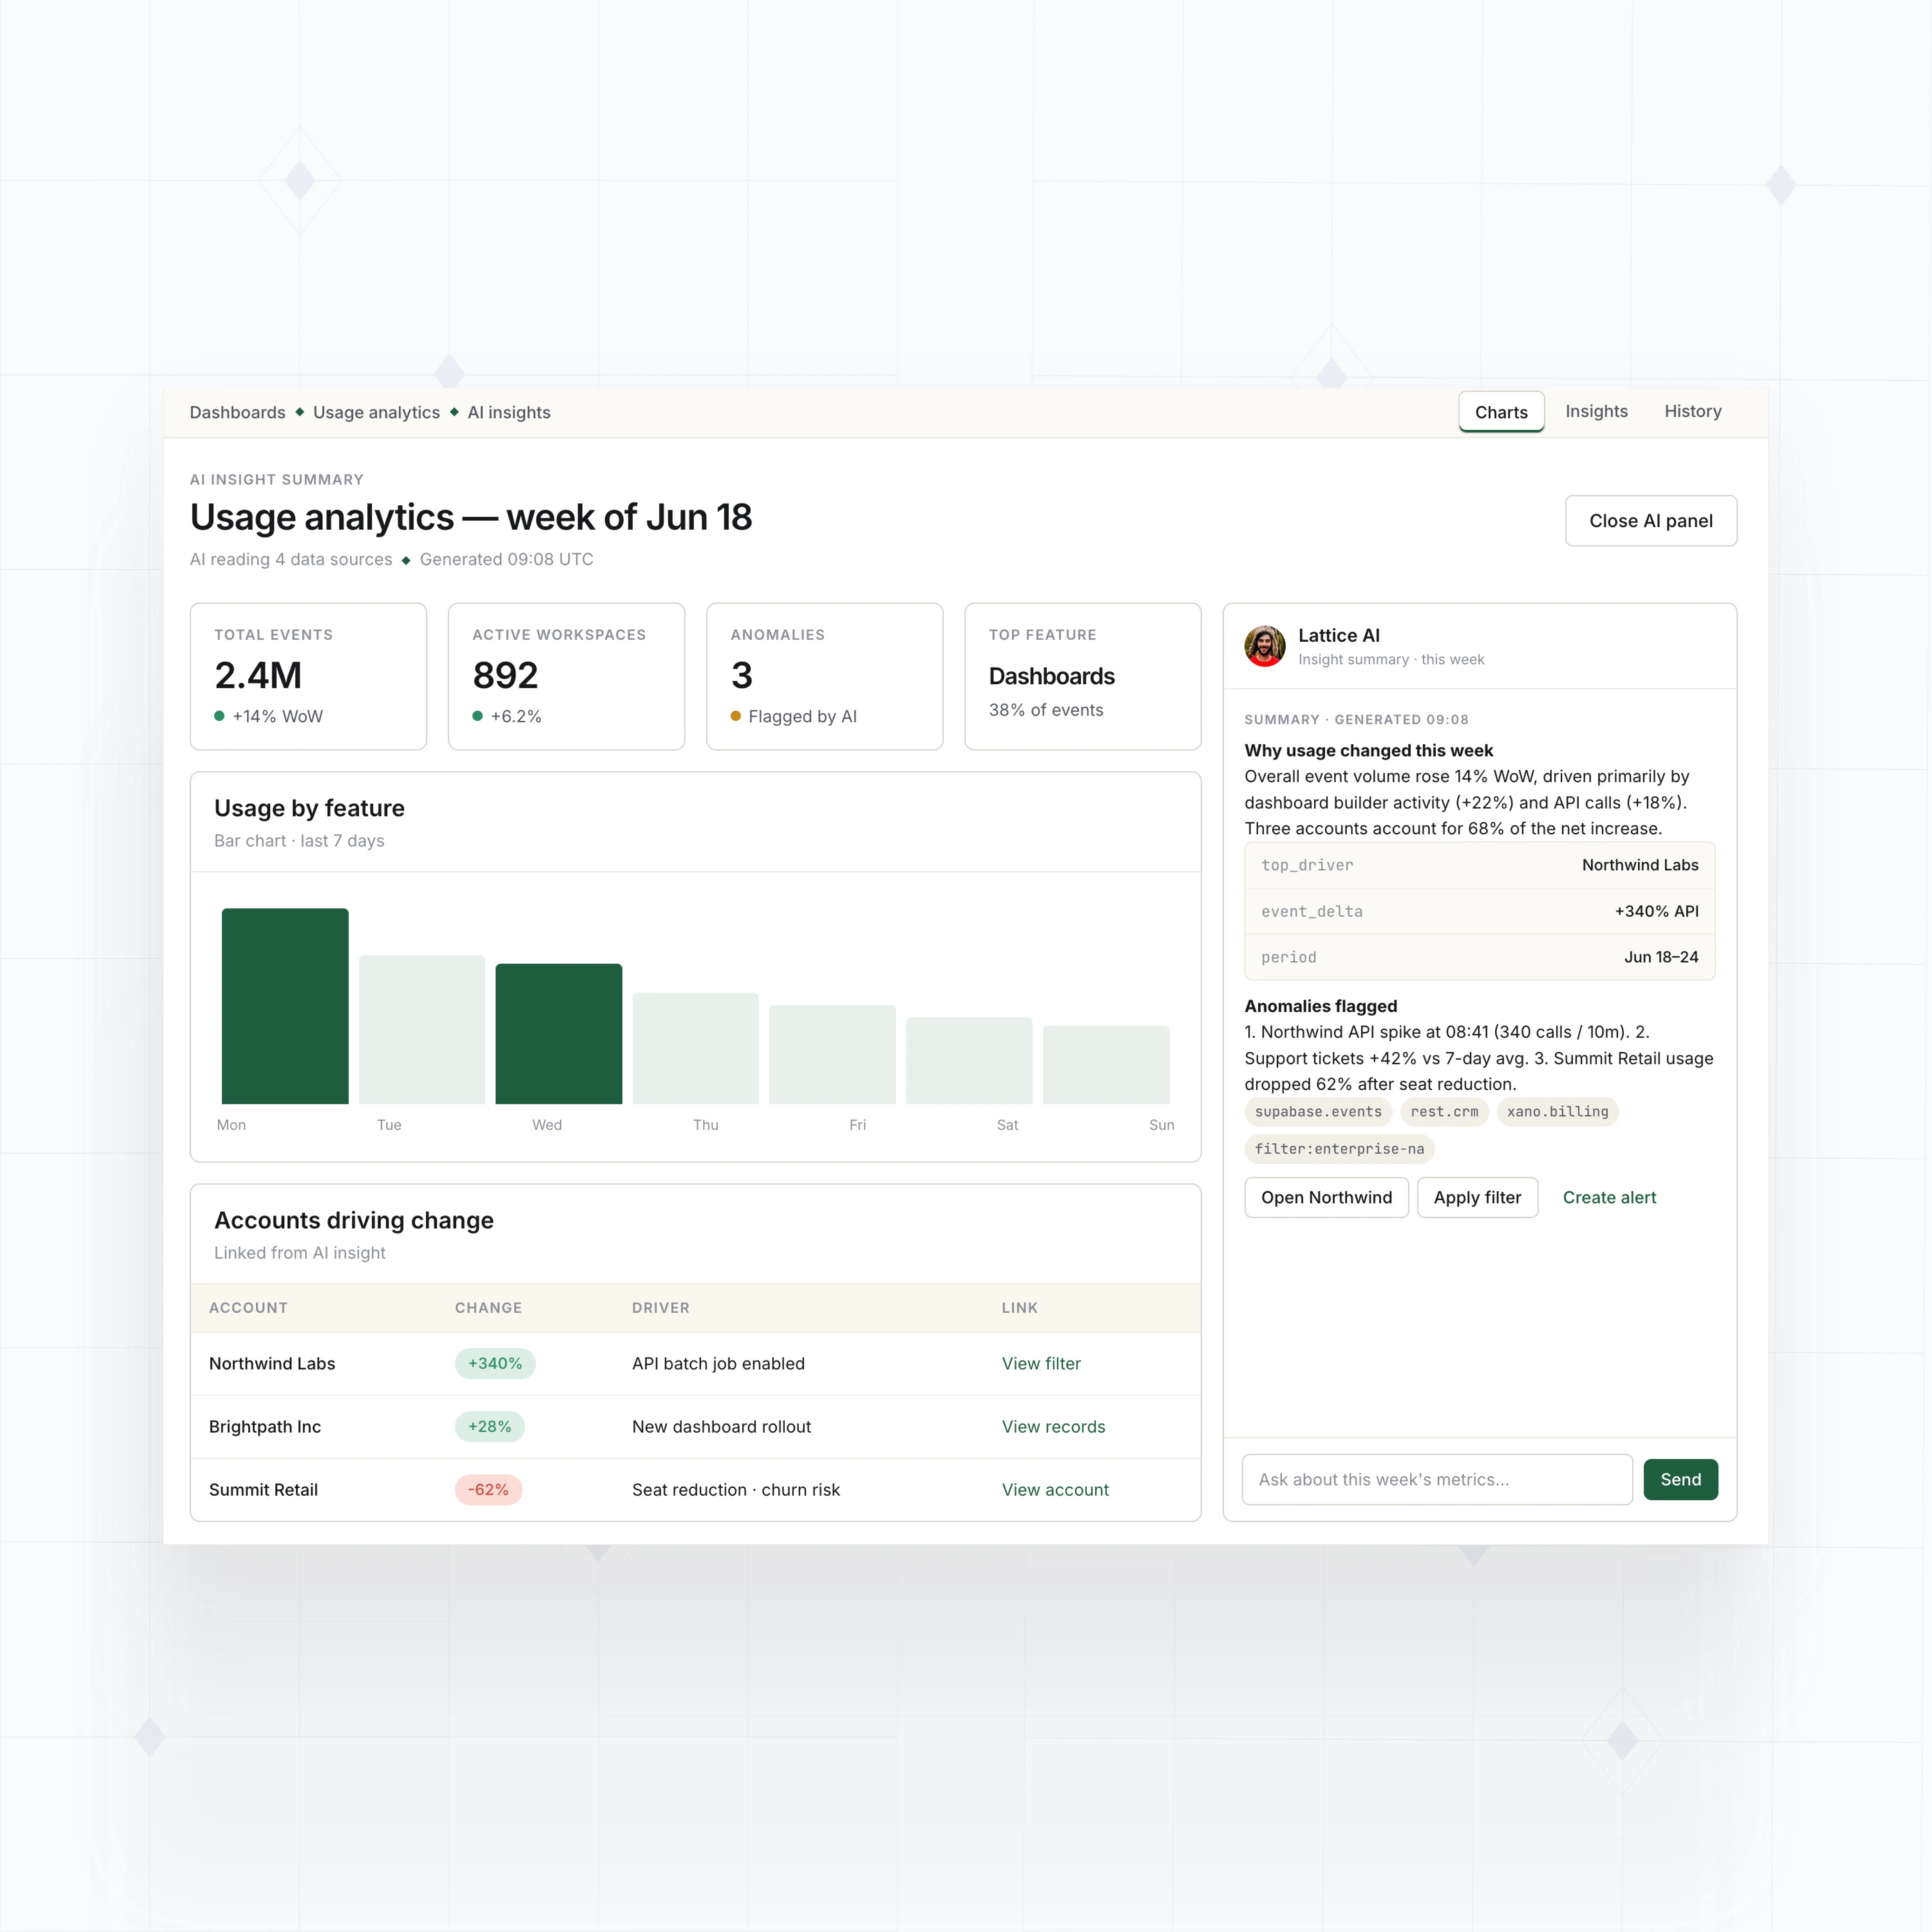
Add the dashboard features teams keep asking for
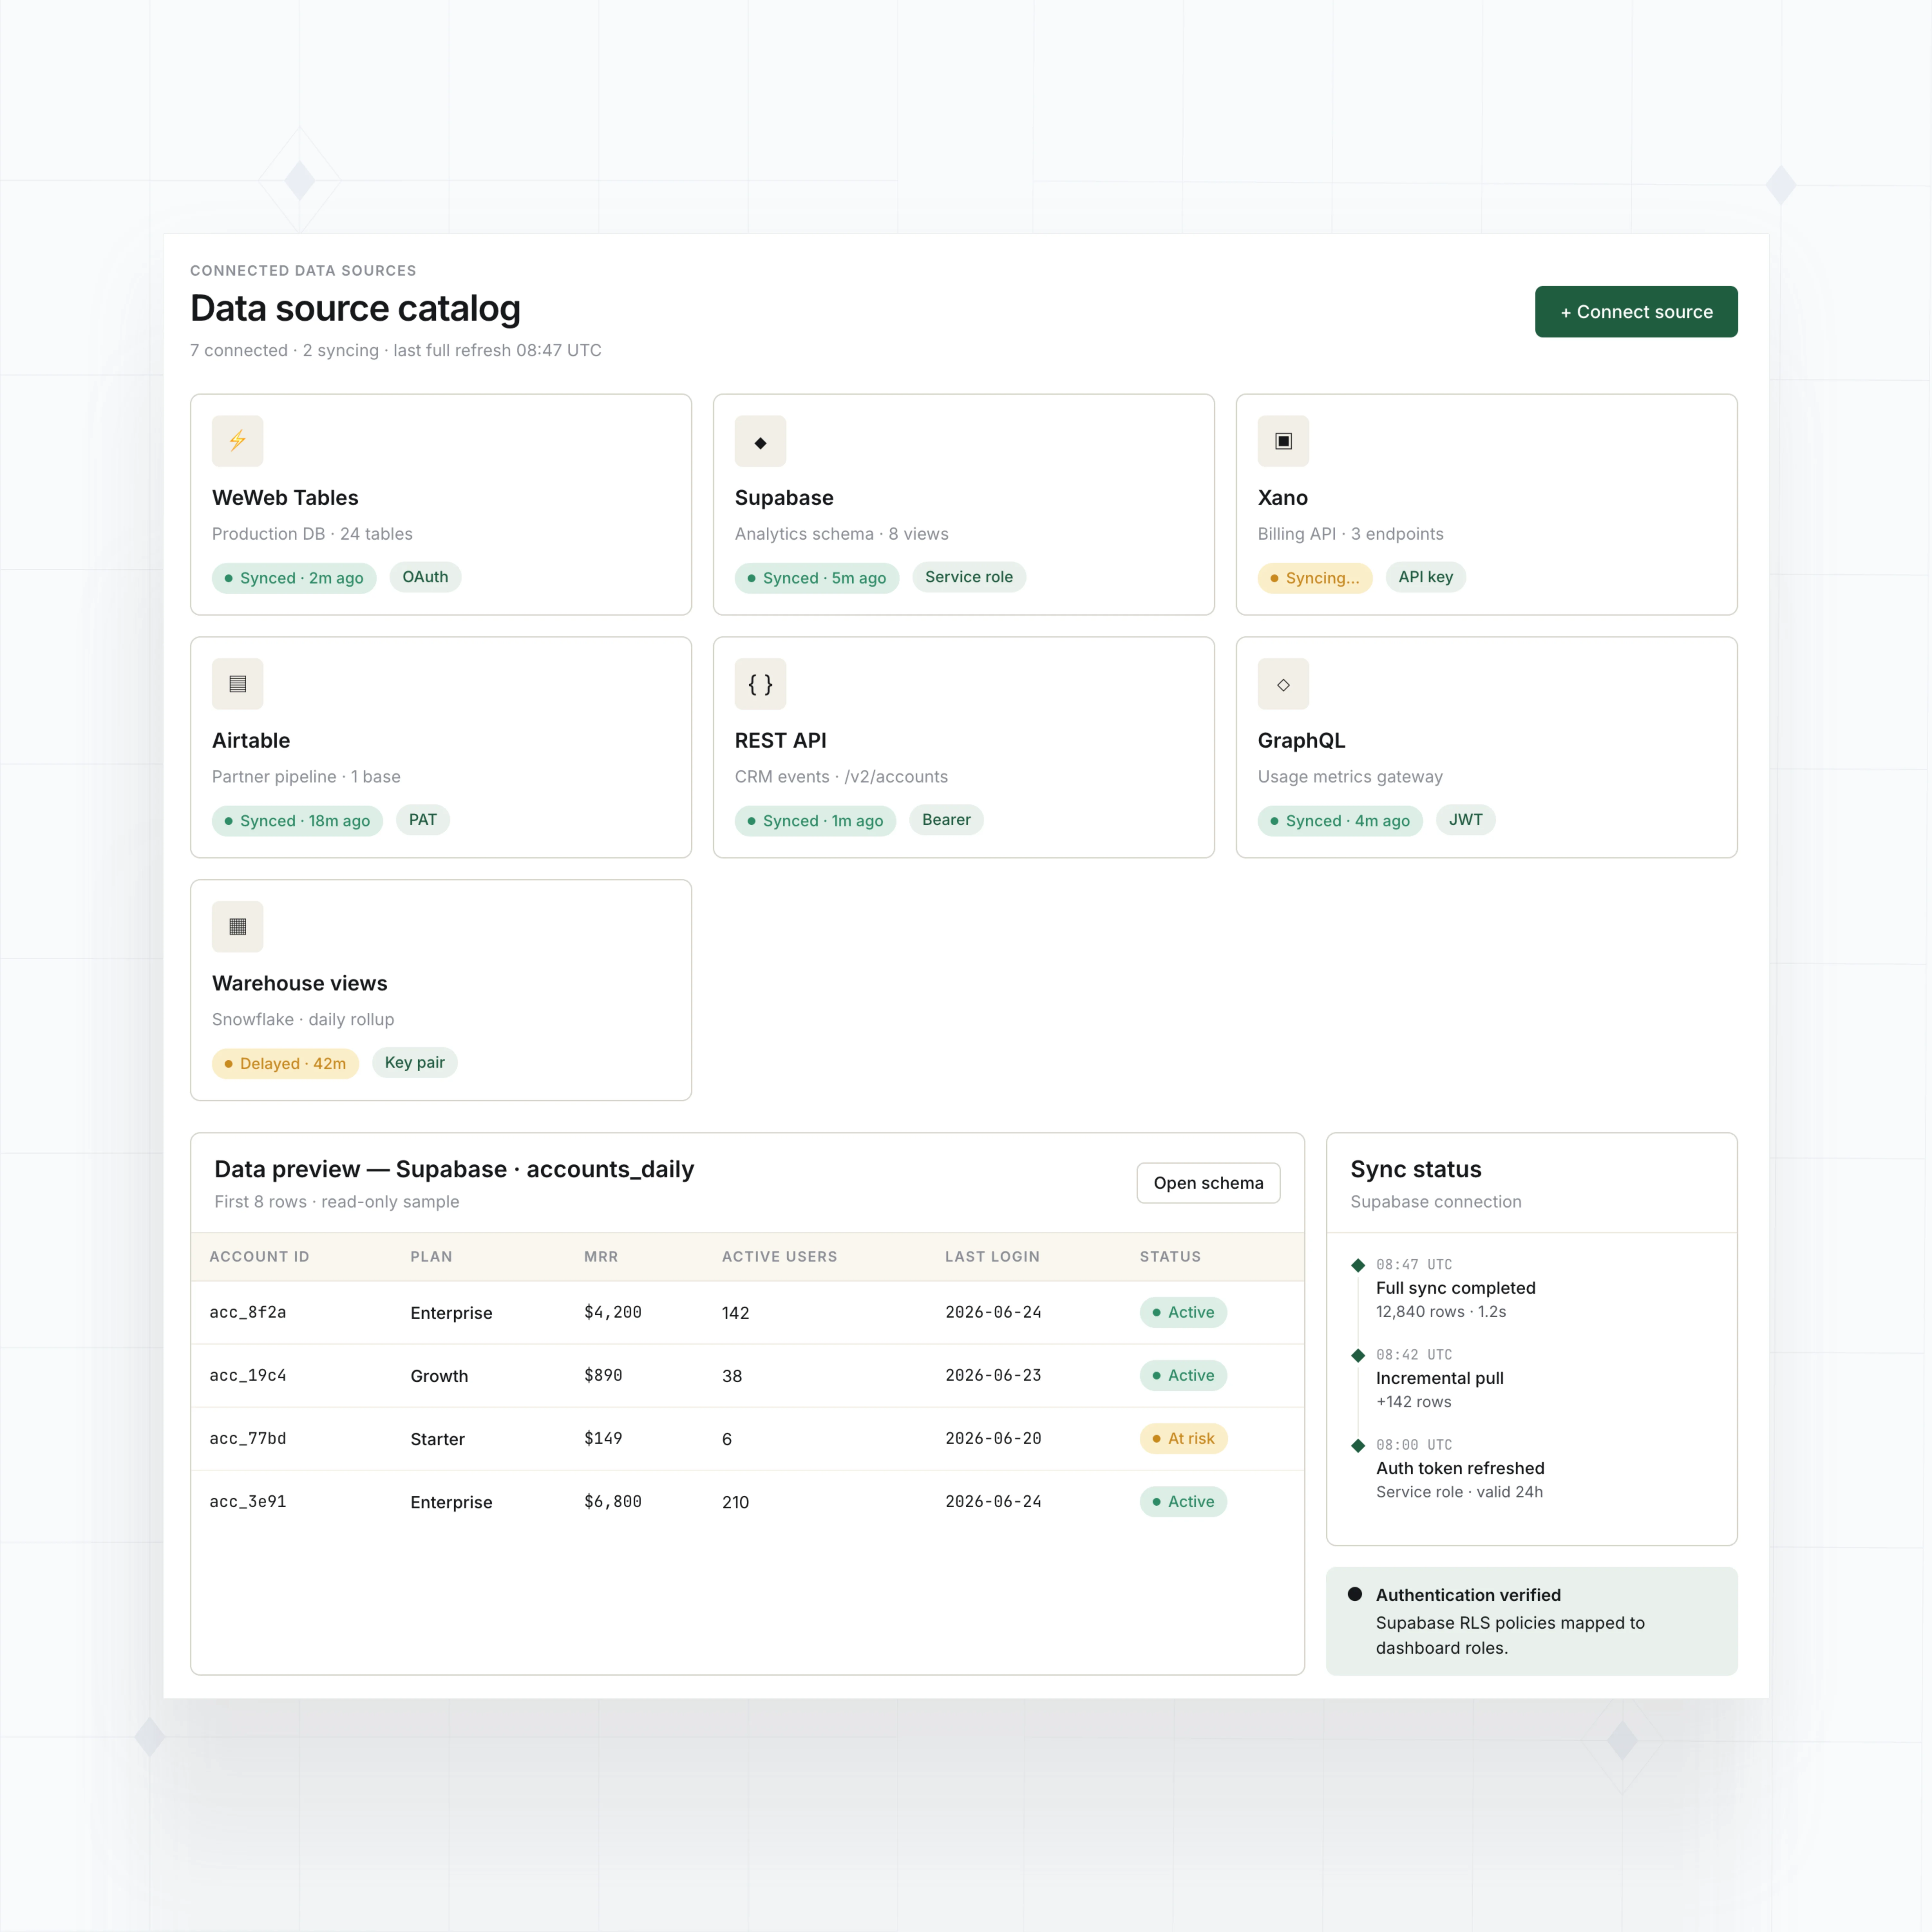
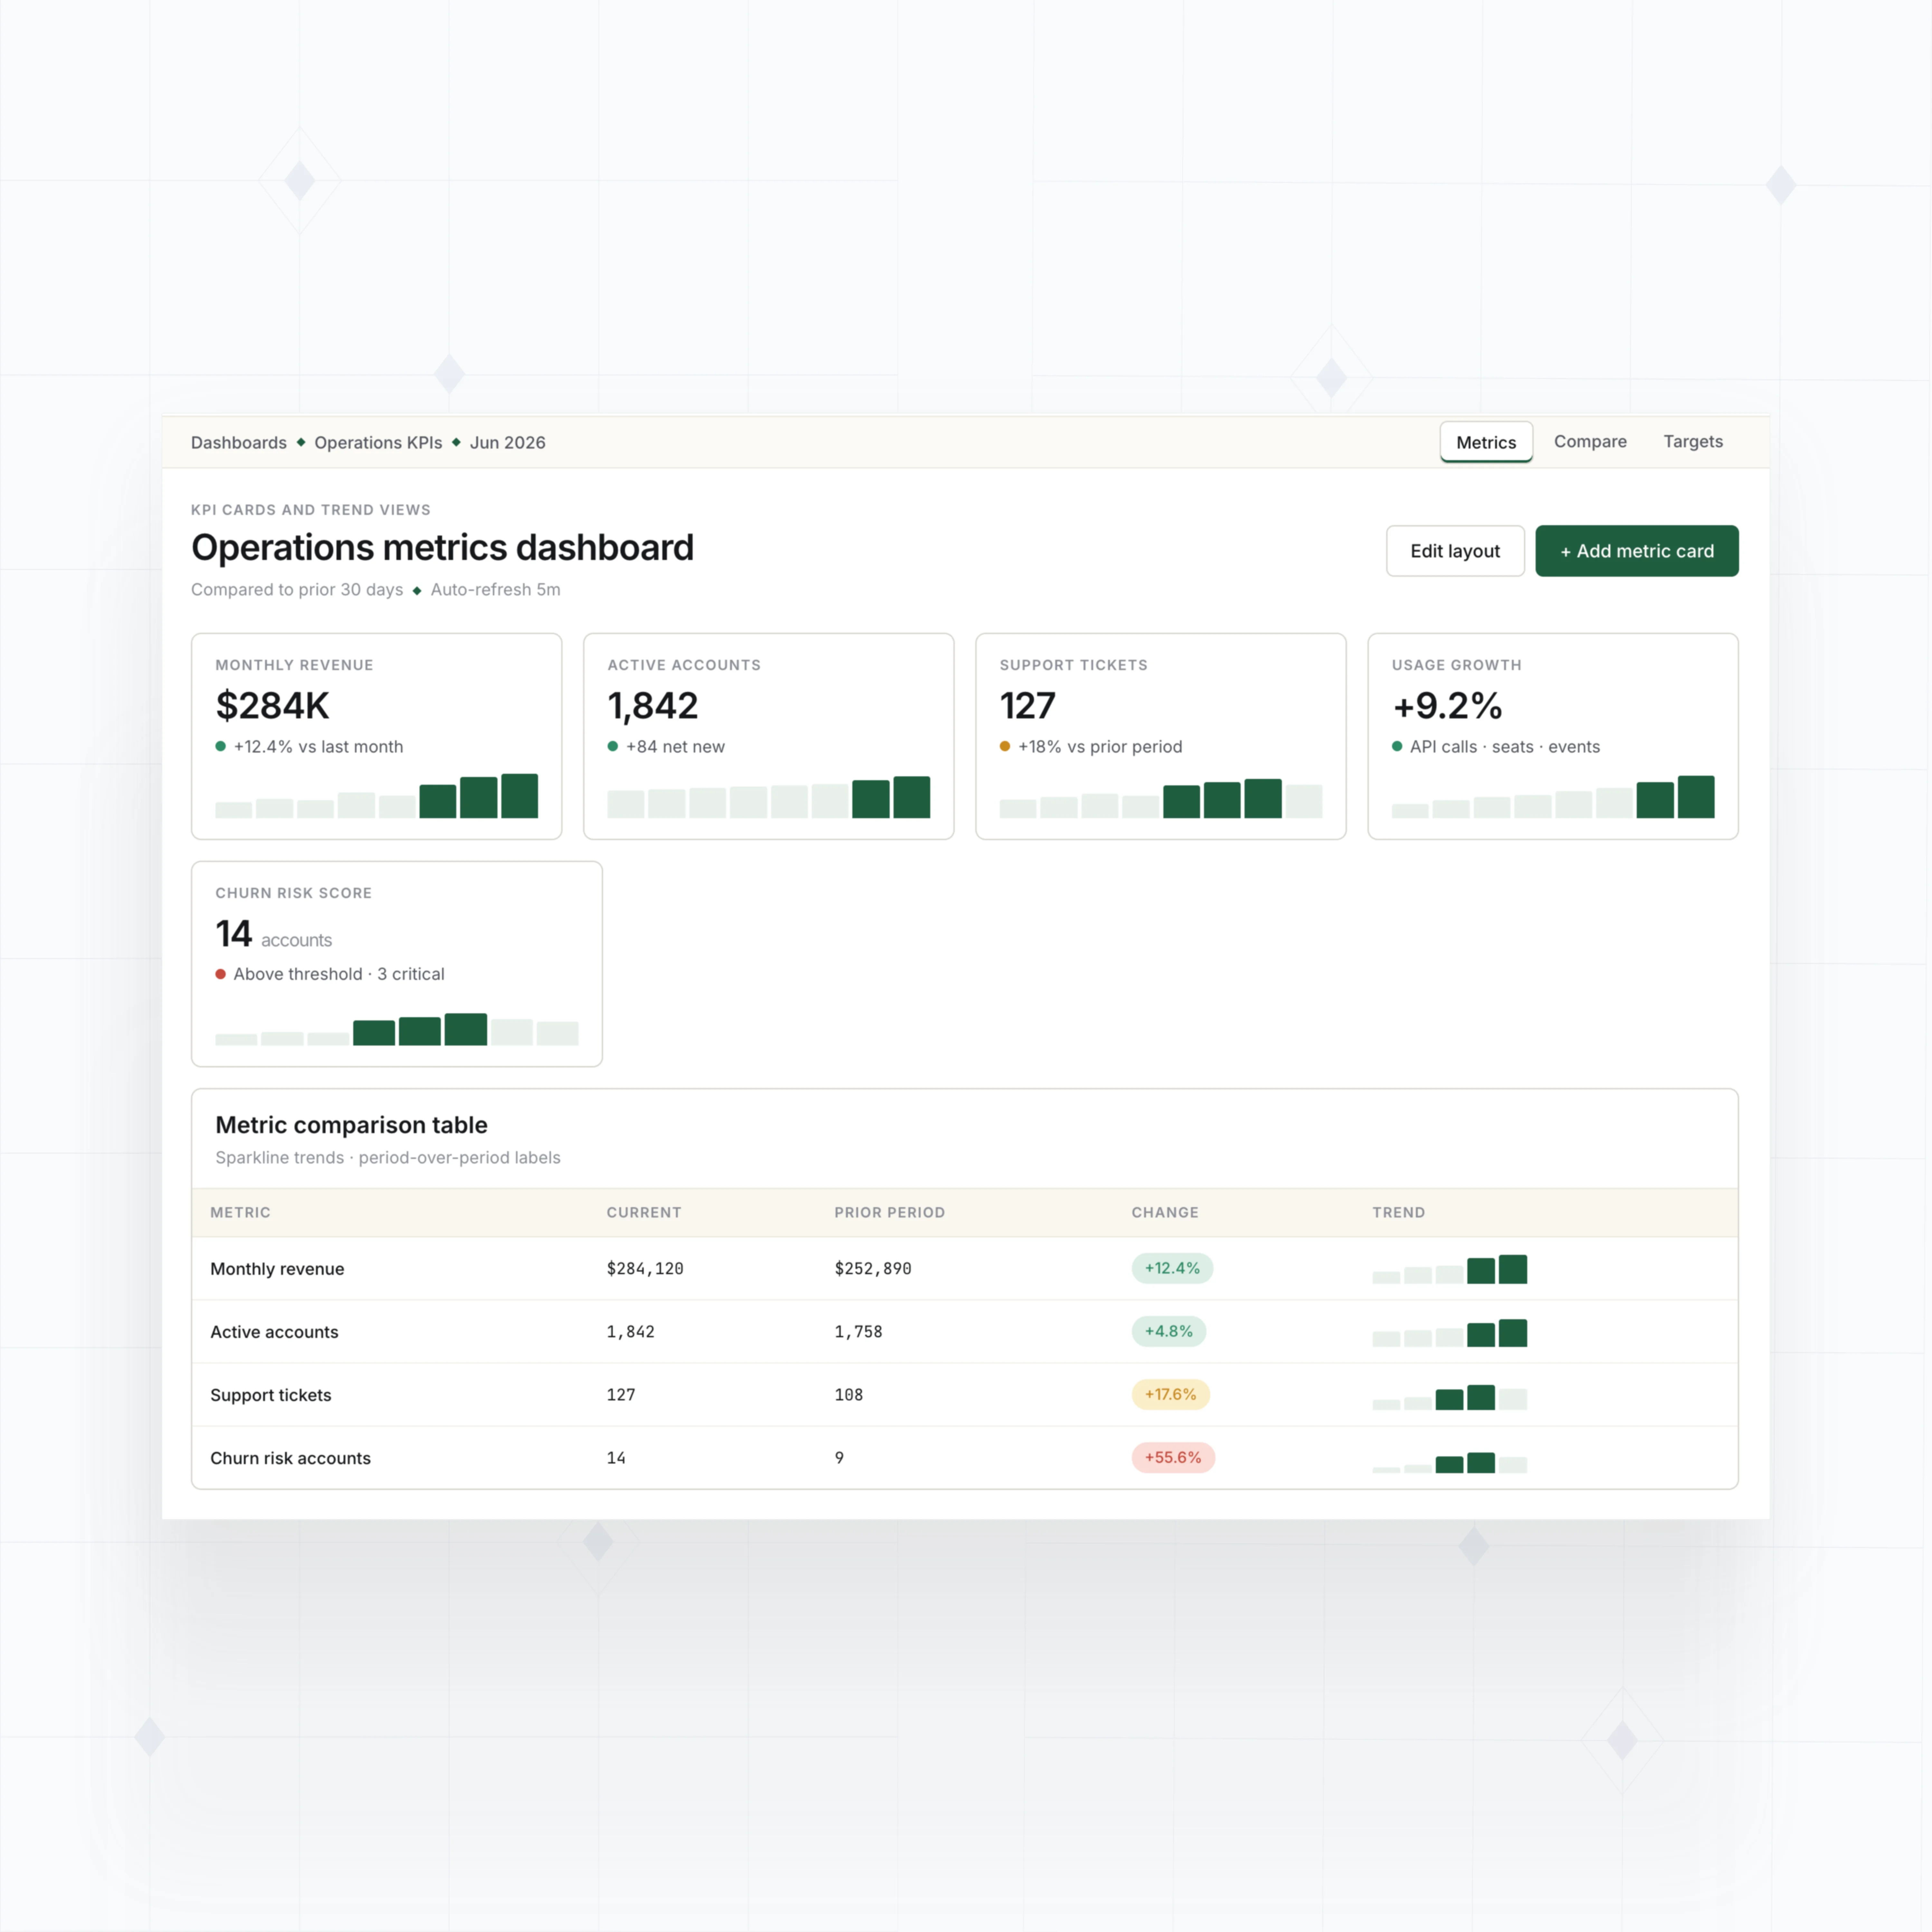
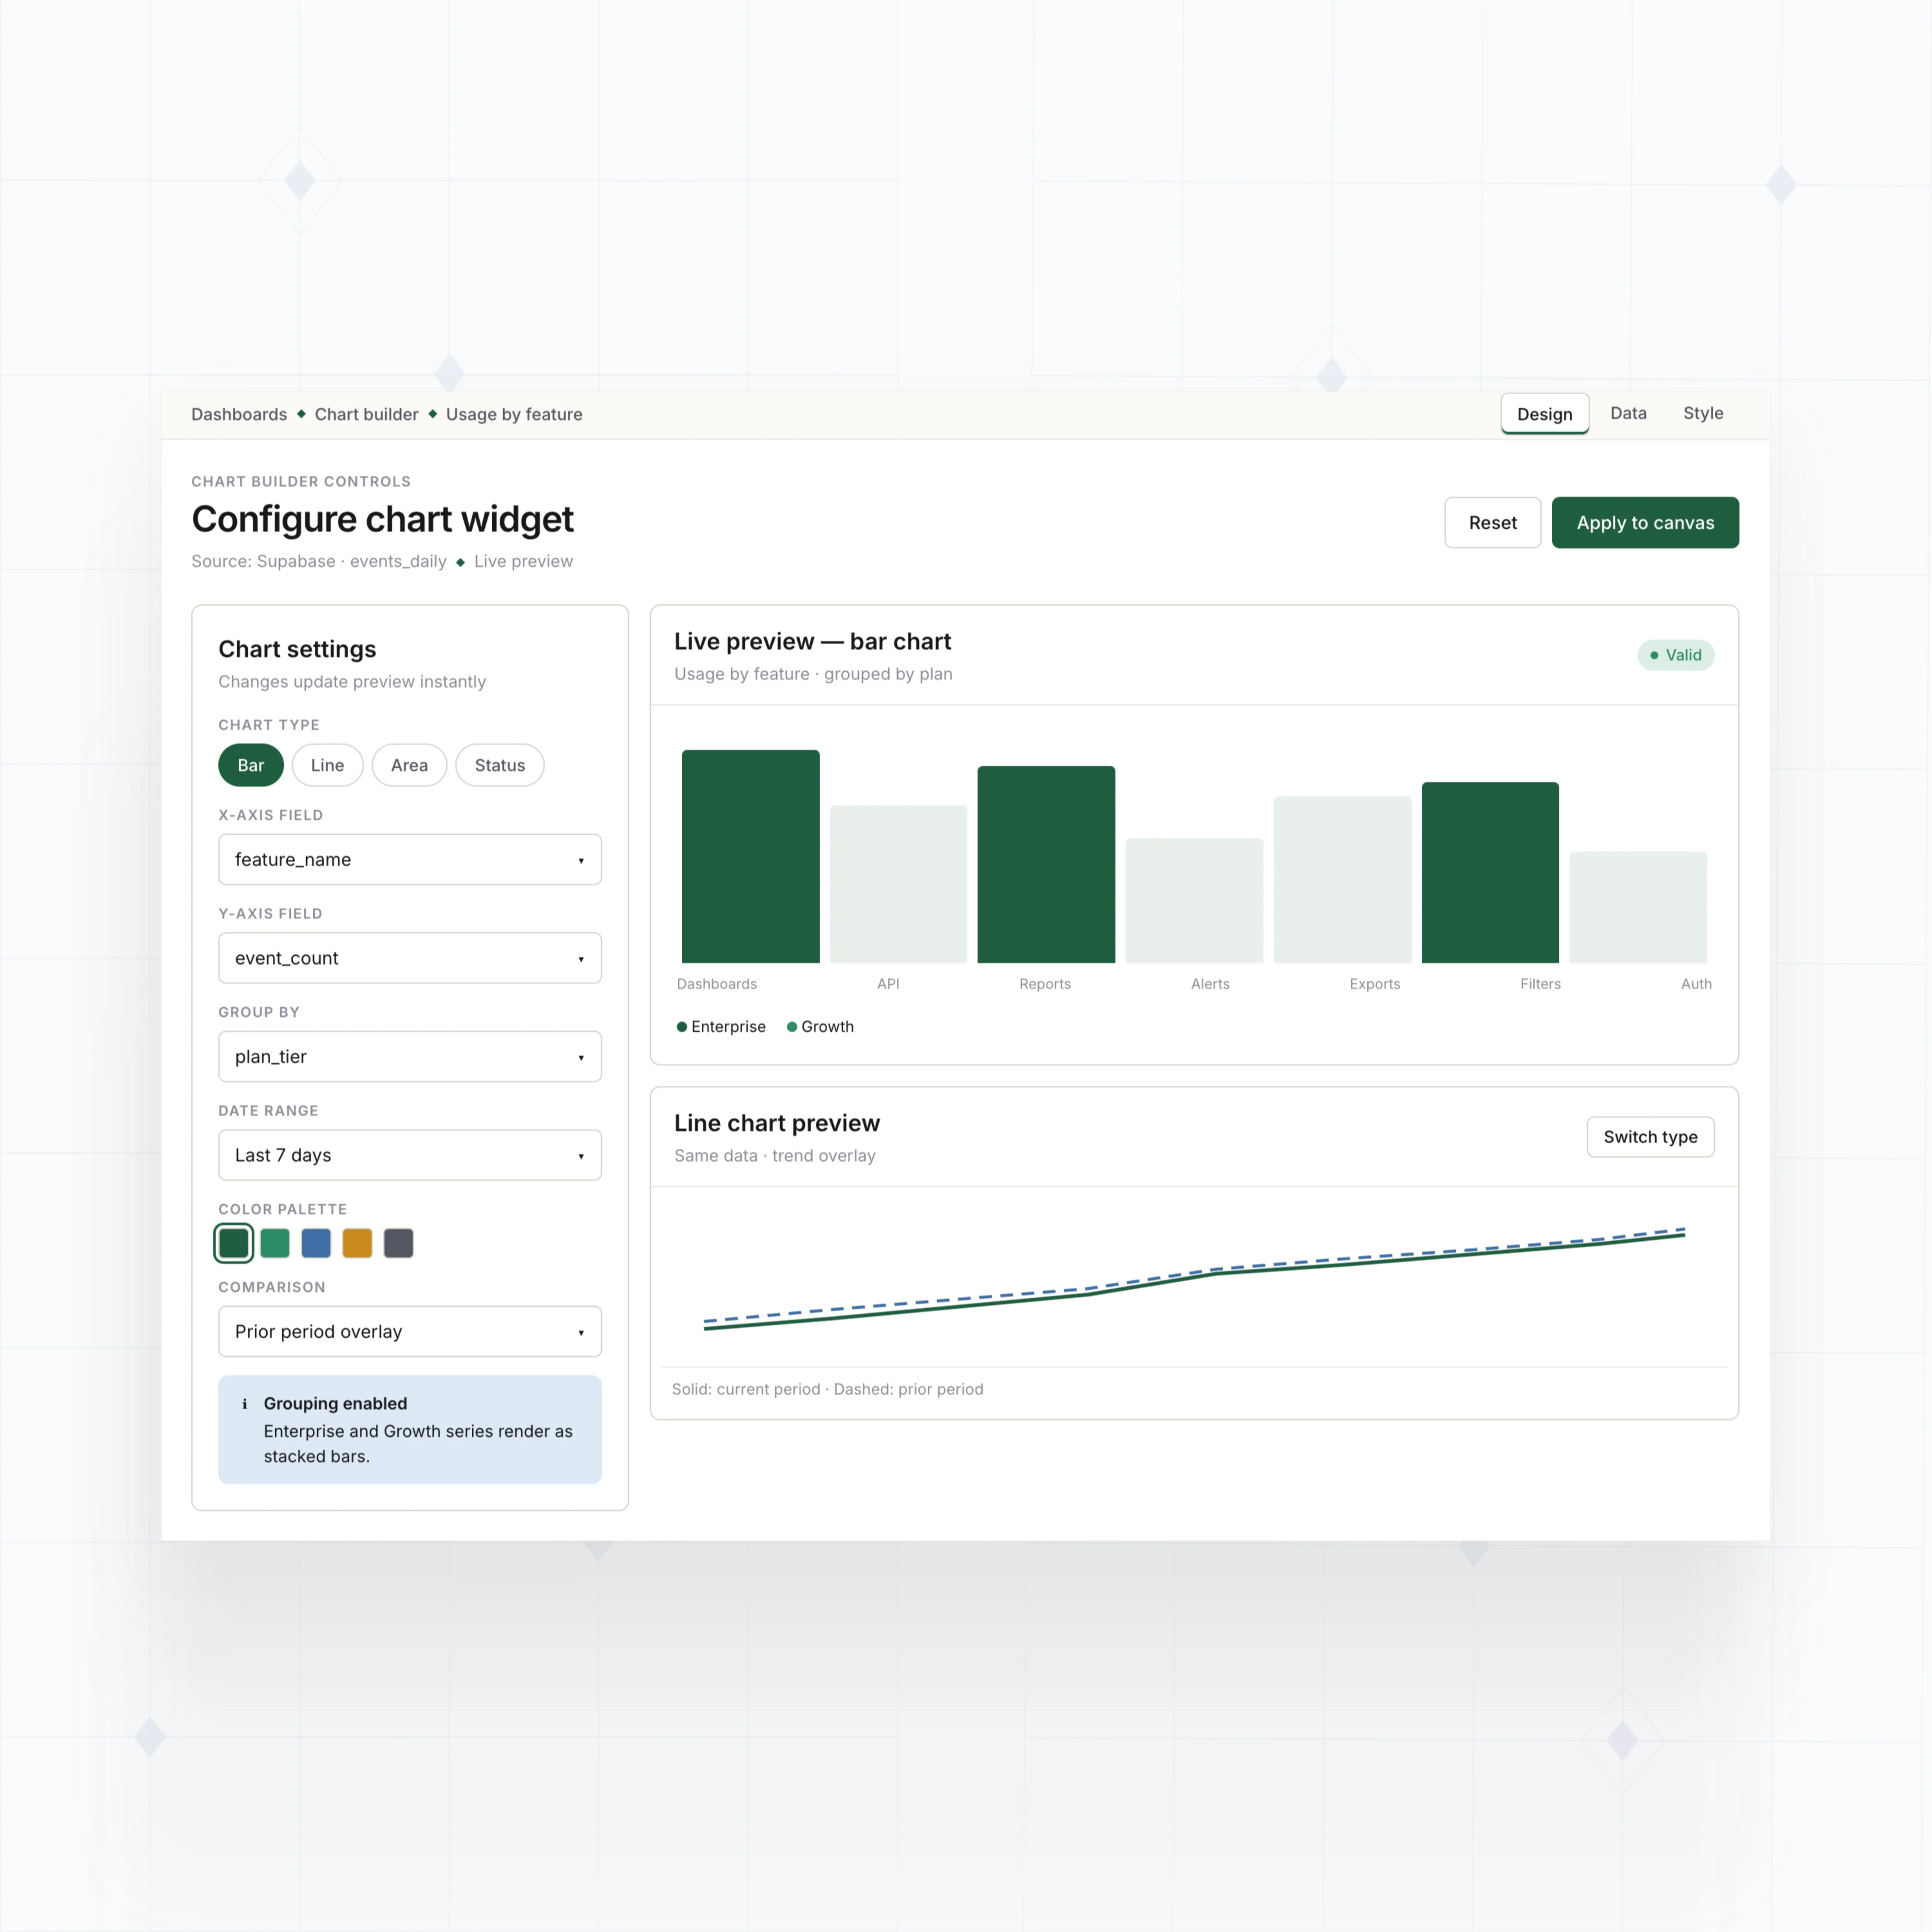
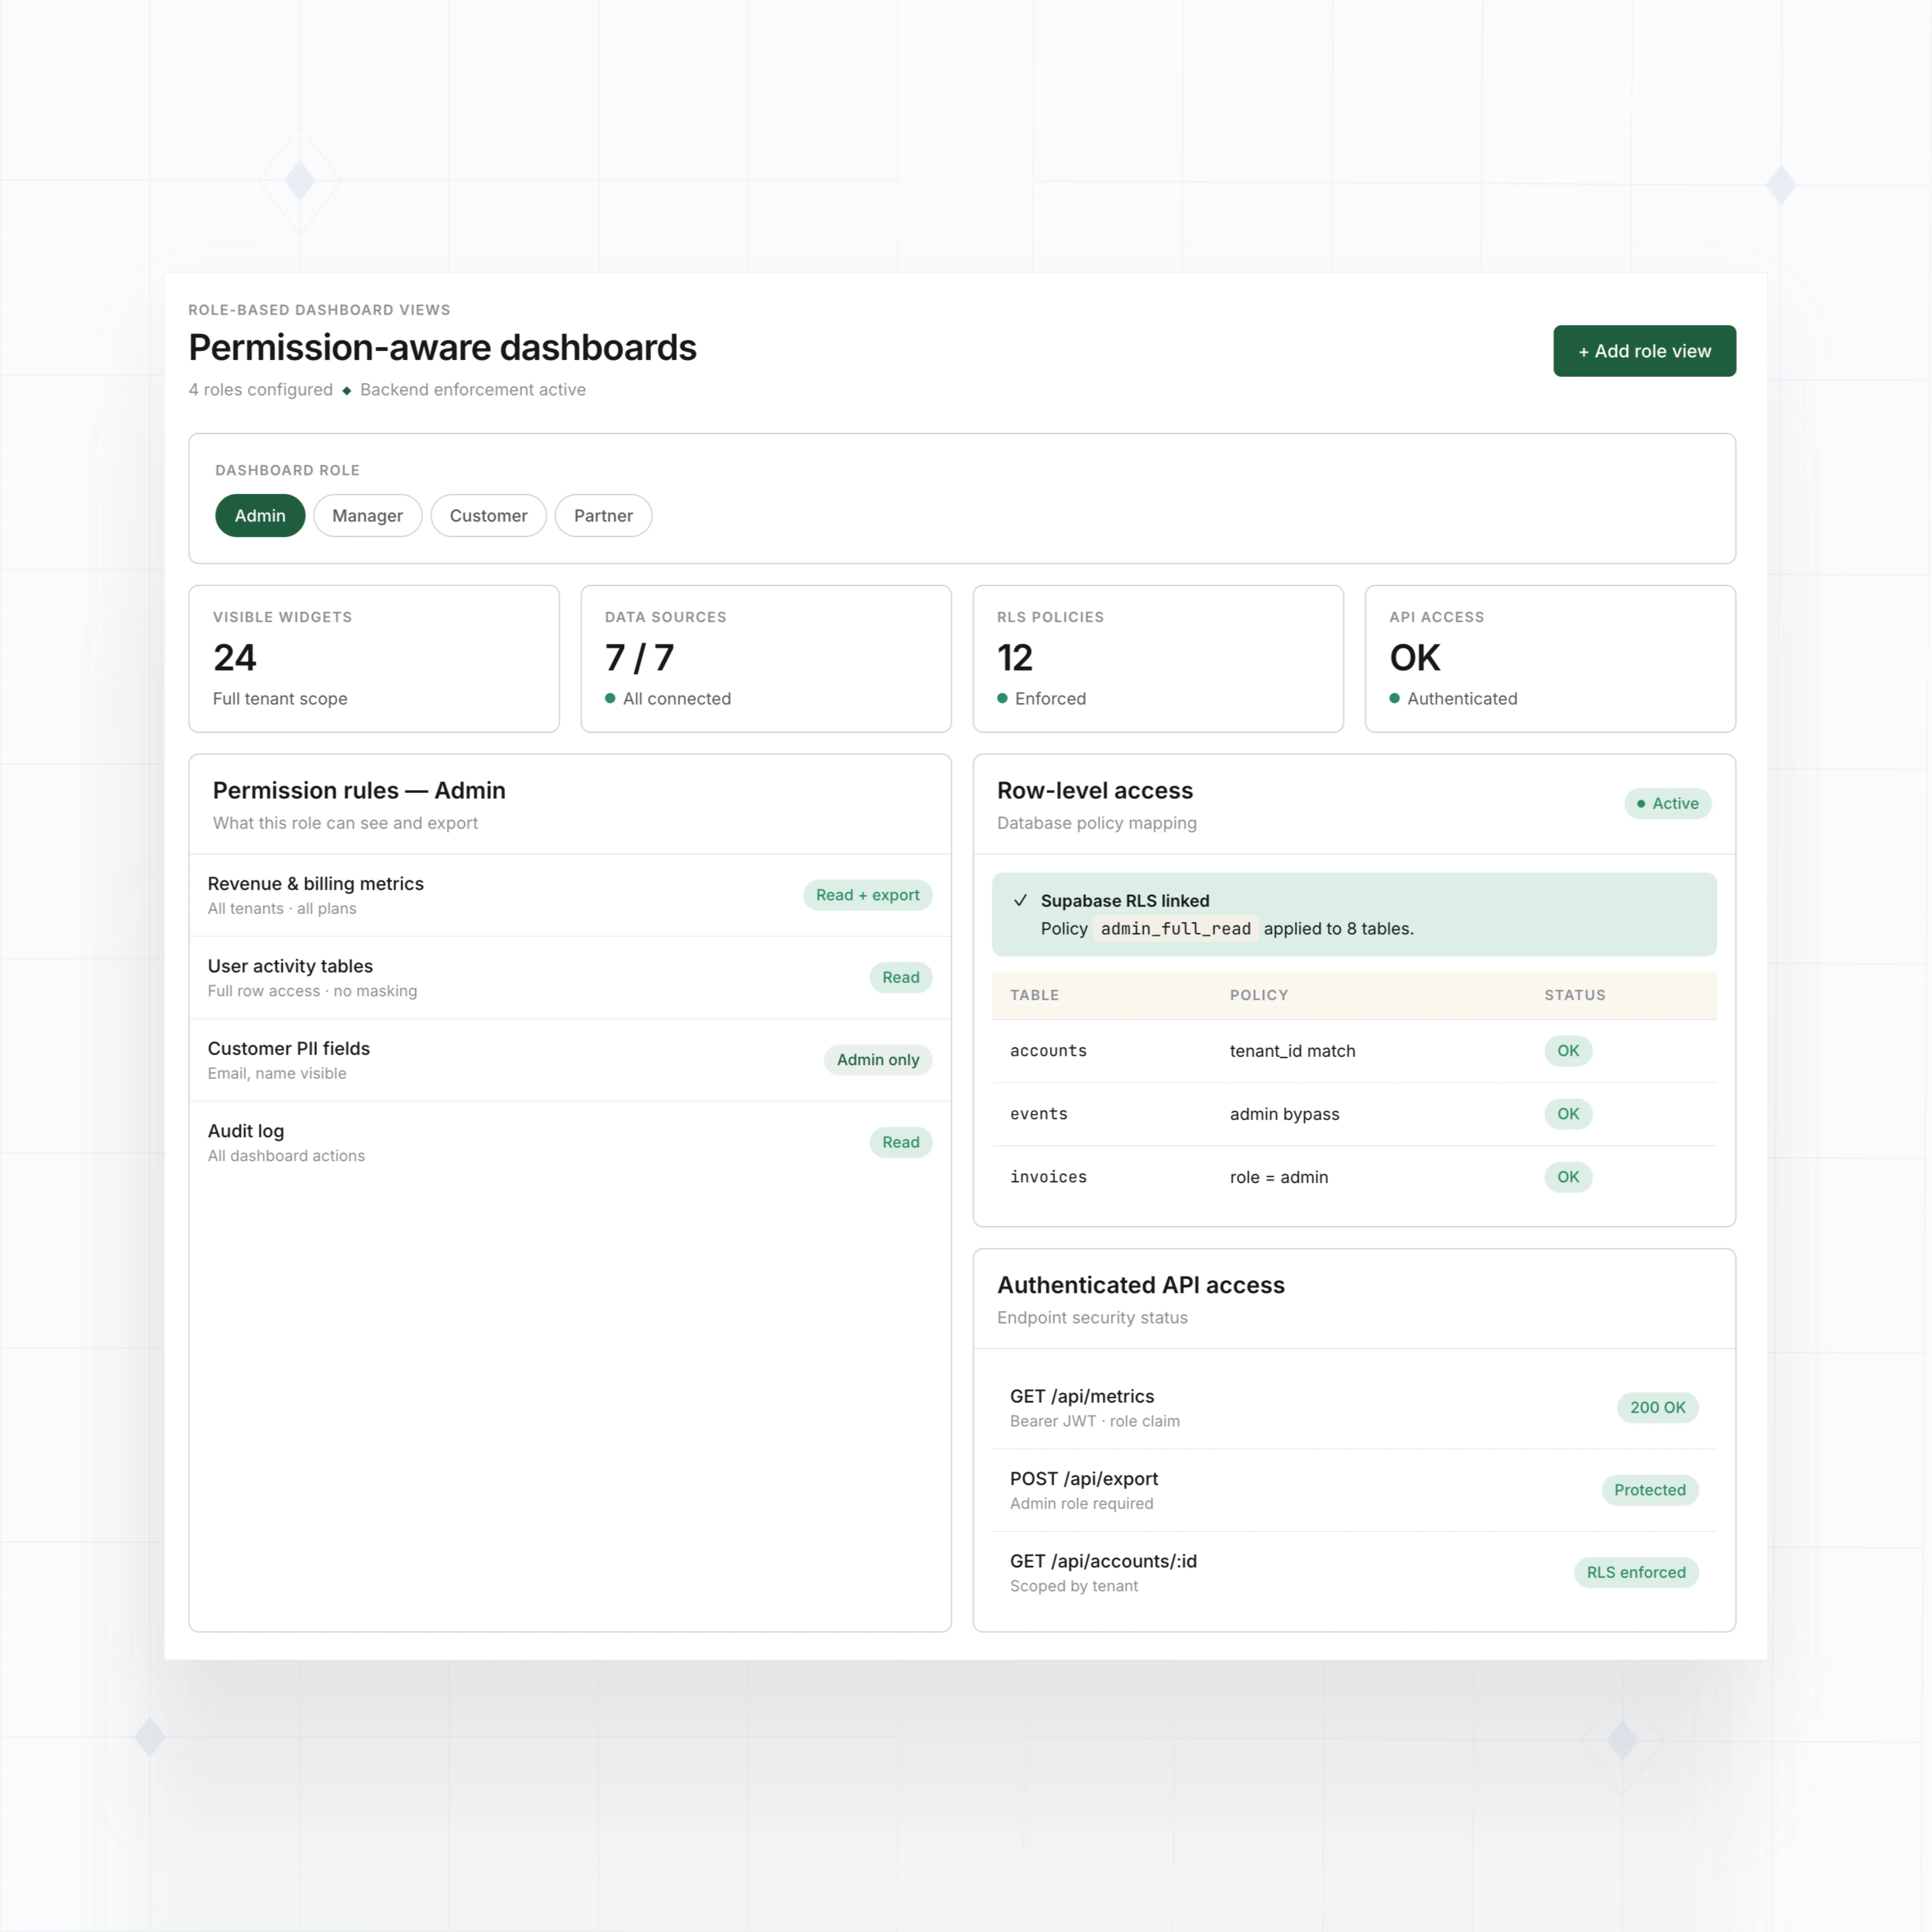
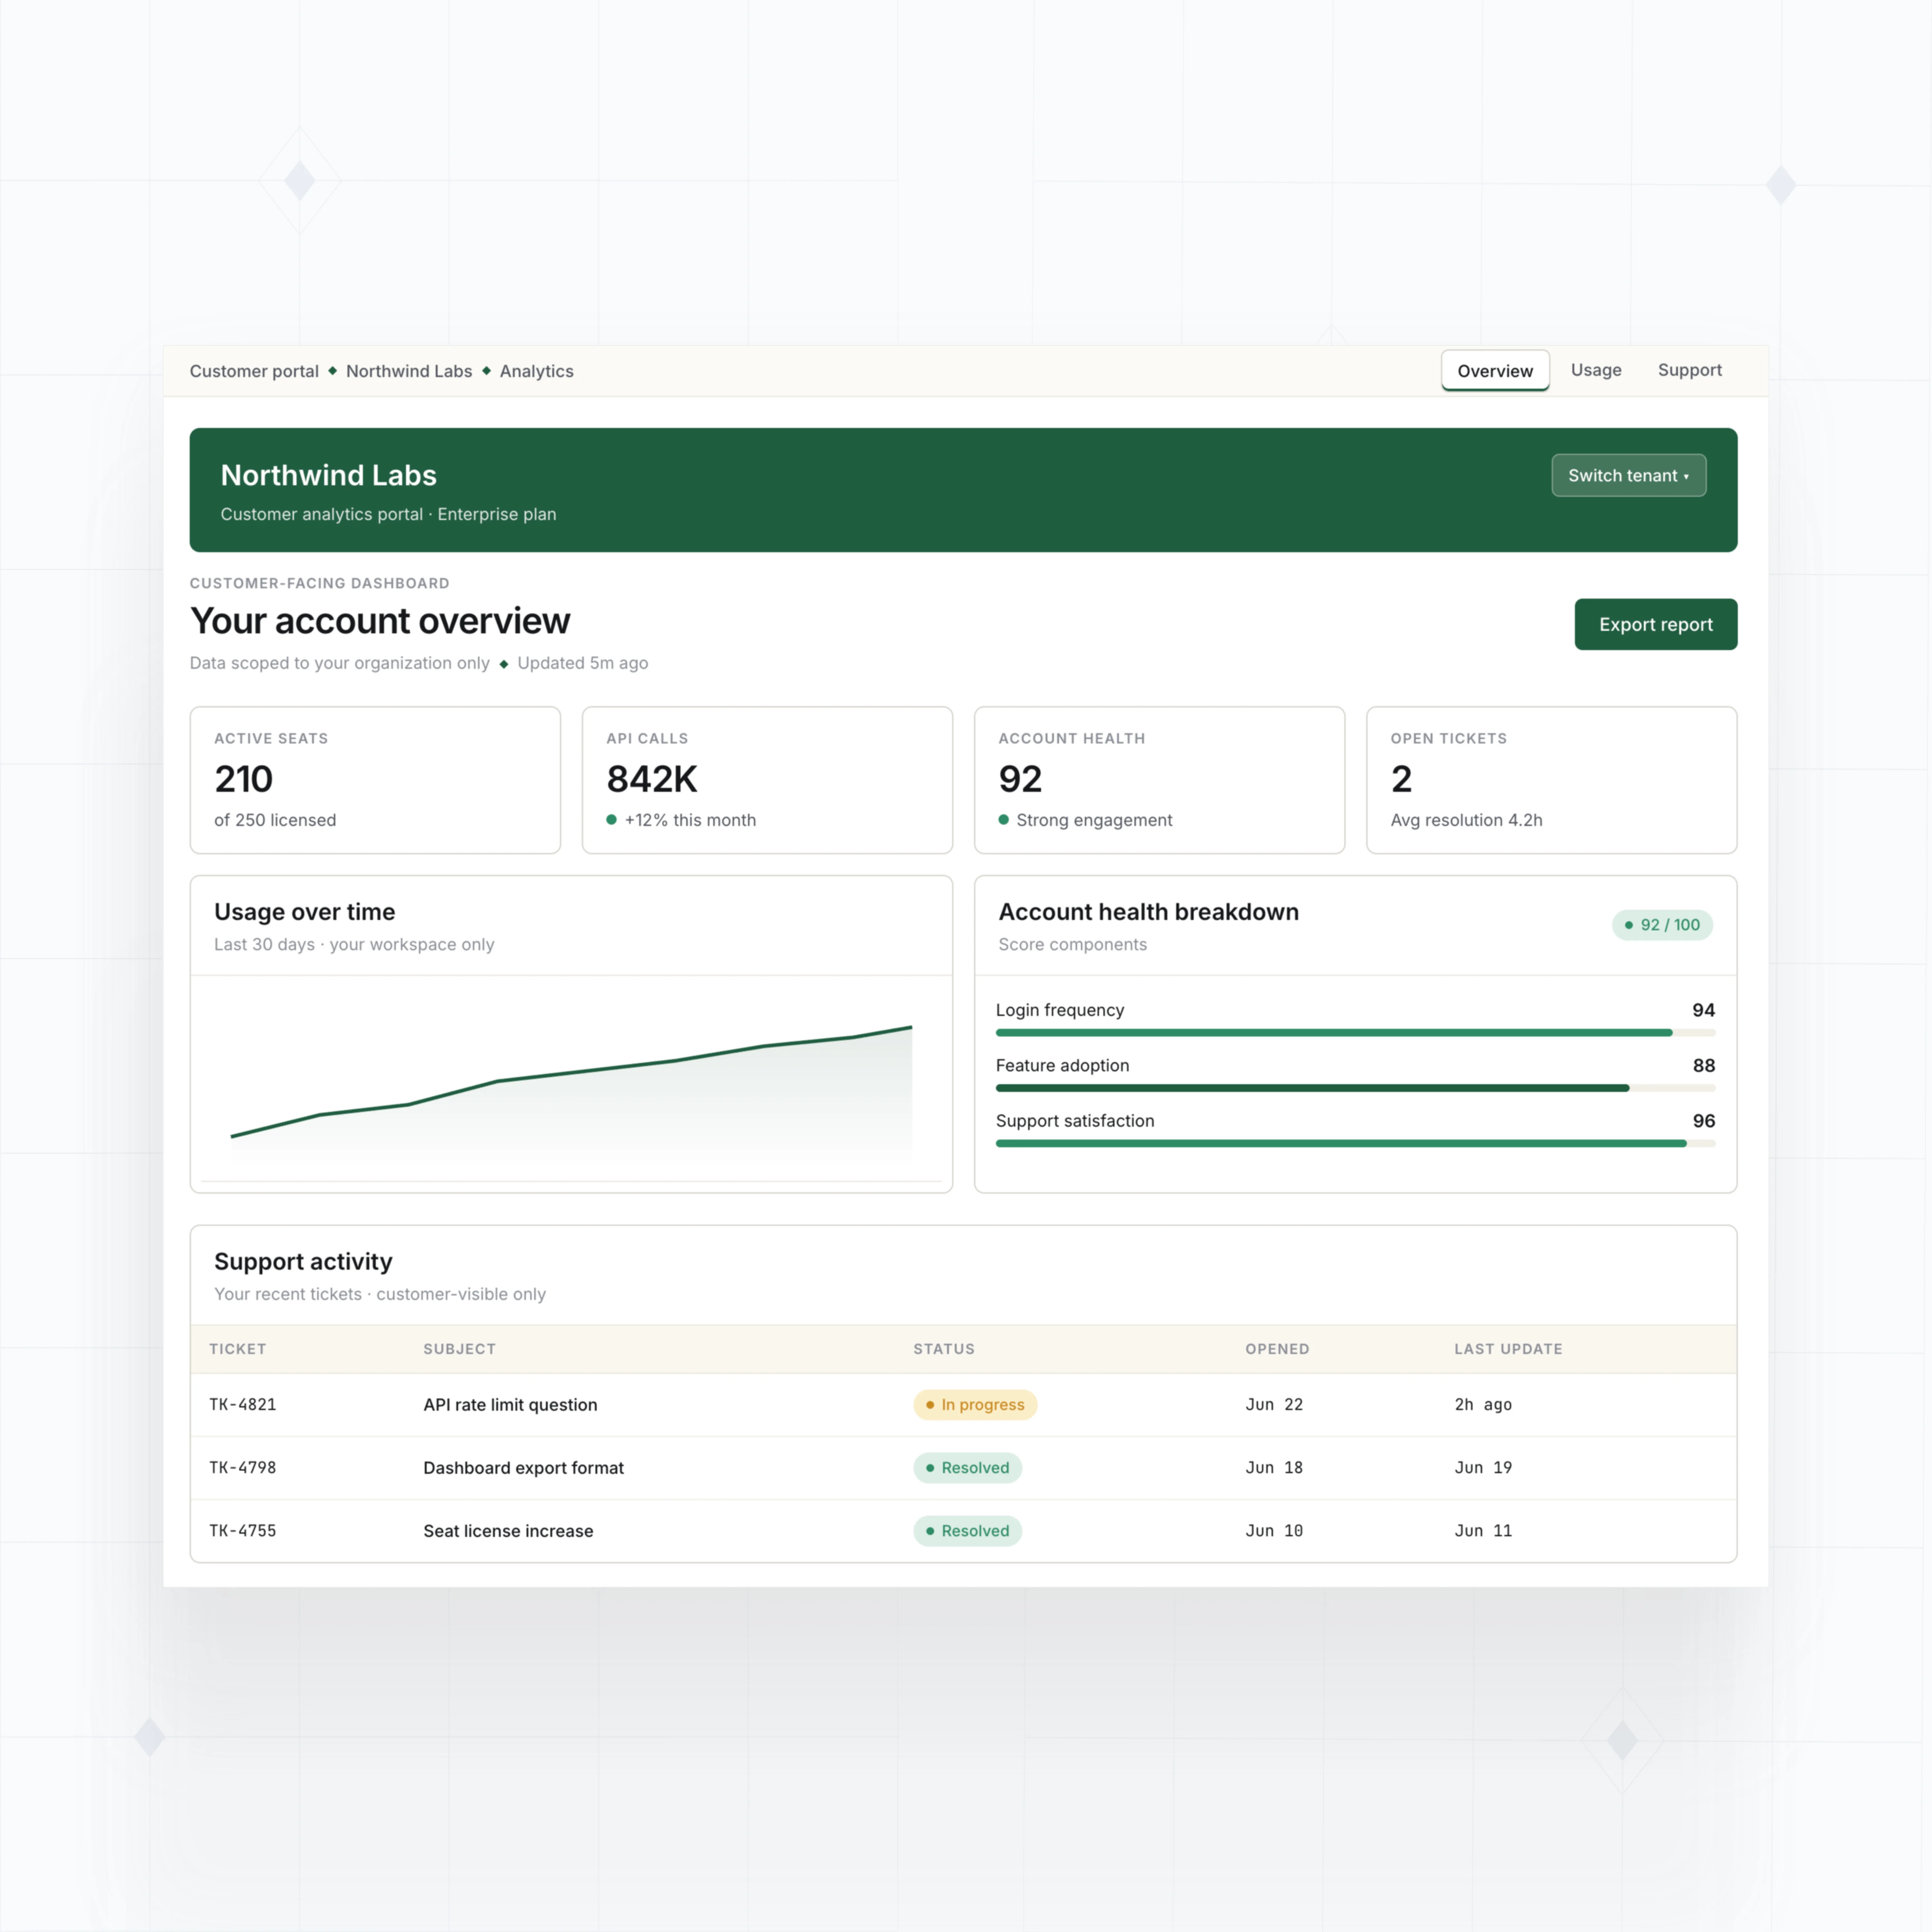
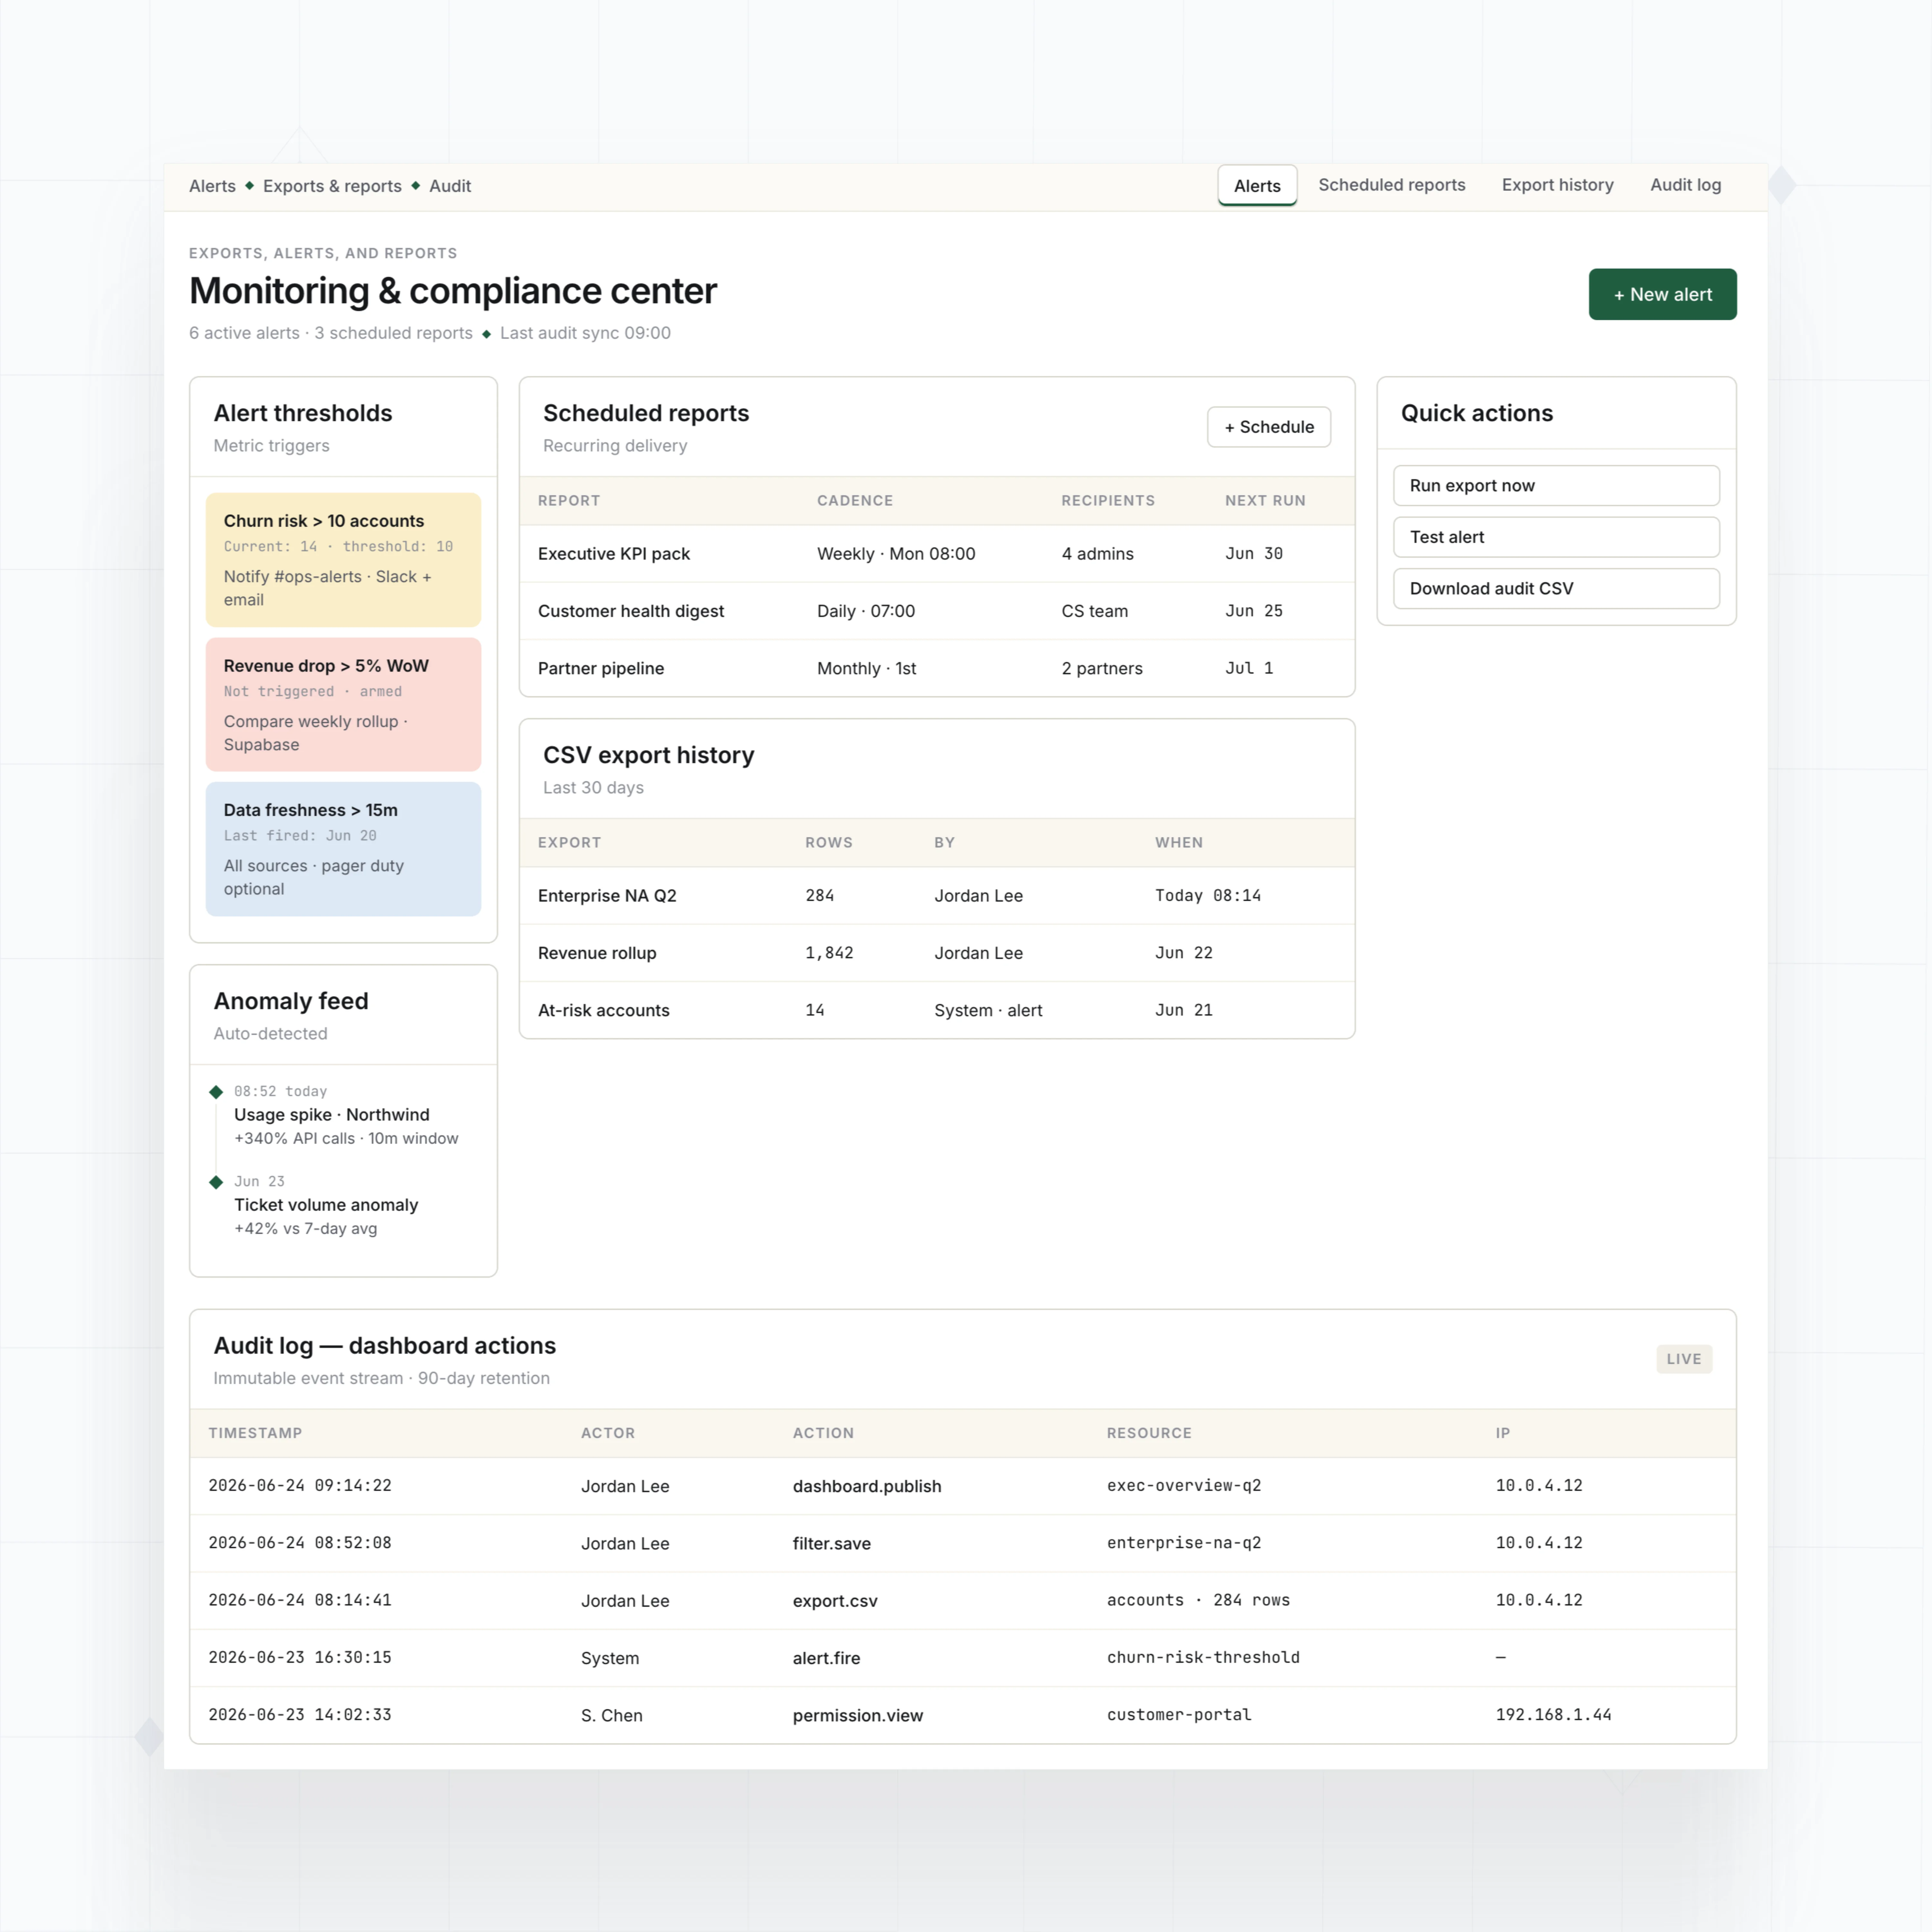
With WeWeb AI and no-code, build KPI cards, charts, saved filters, drilldowns, exports, alerts, audit views, customer dashboards, and AI insight summaries around your data.


Choosing WeWeb to build W4.0 was a no-brainer. Compared to other options, there simply wasn’t a competitor.

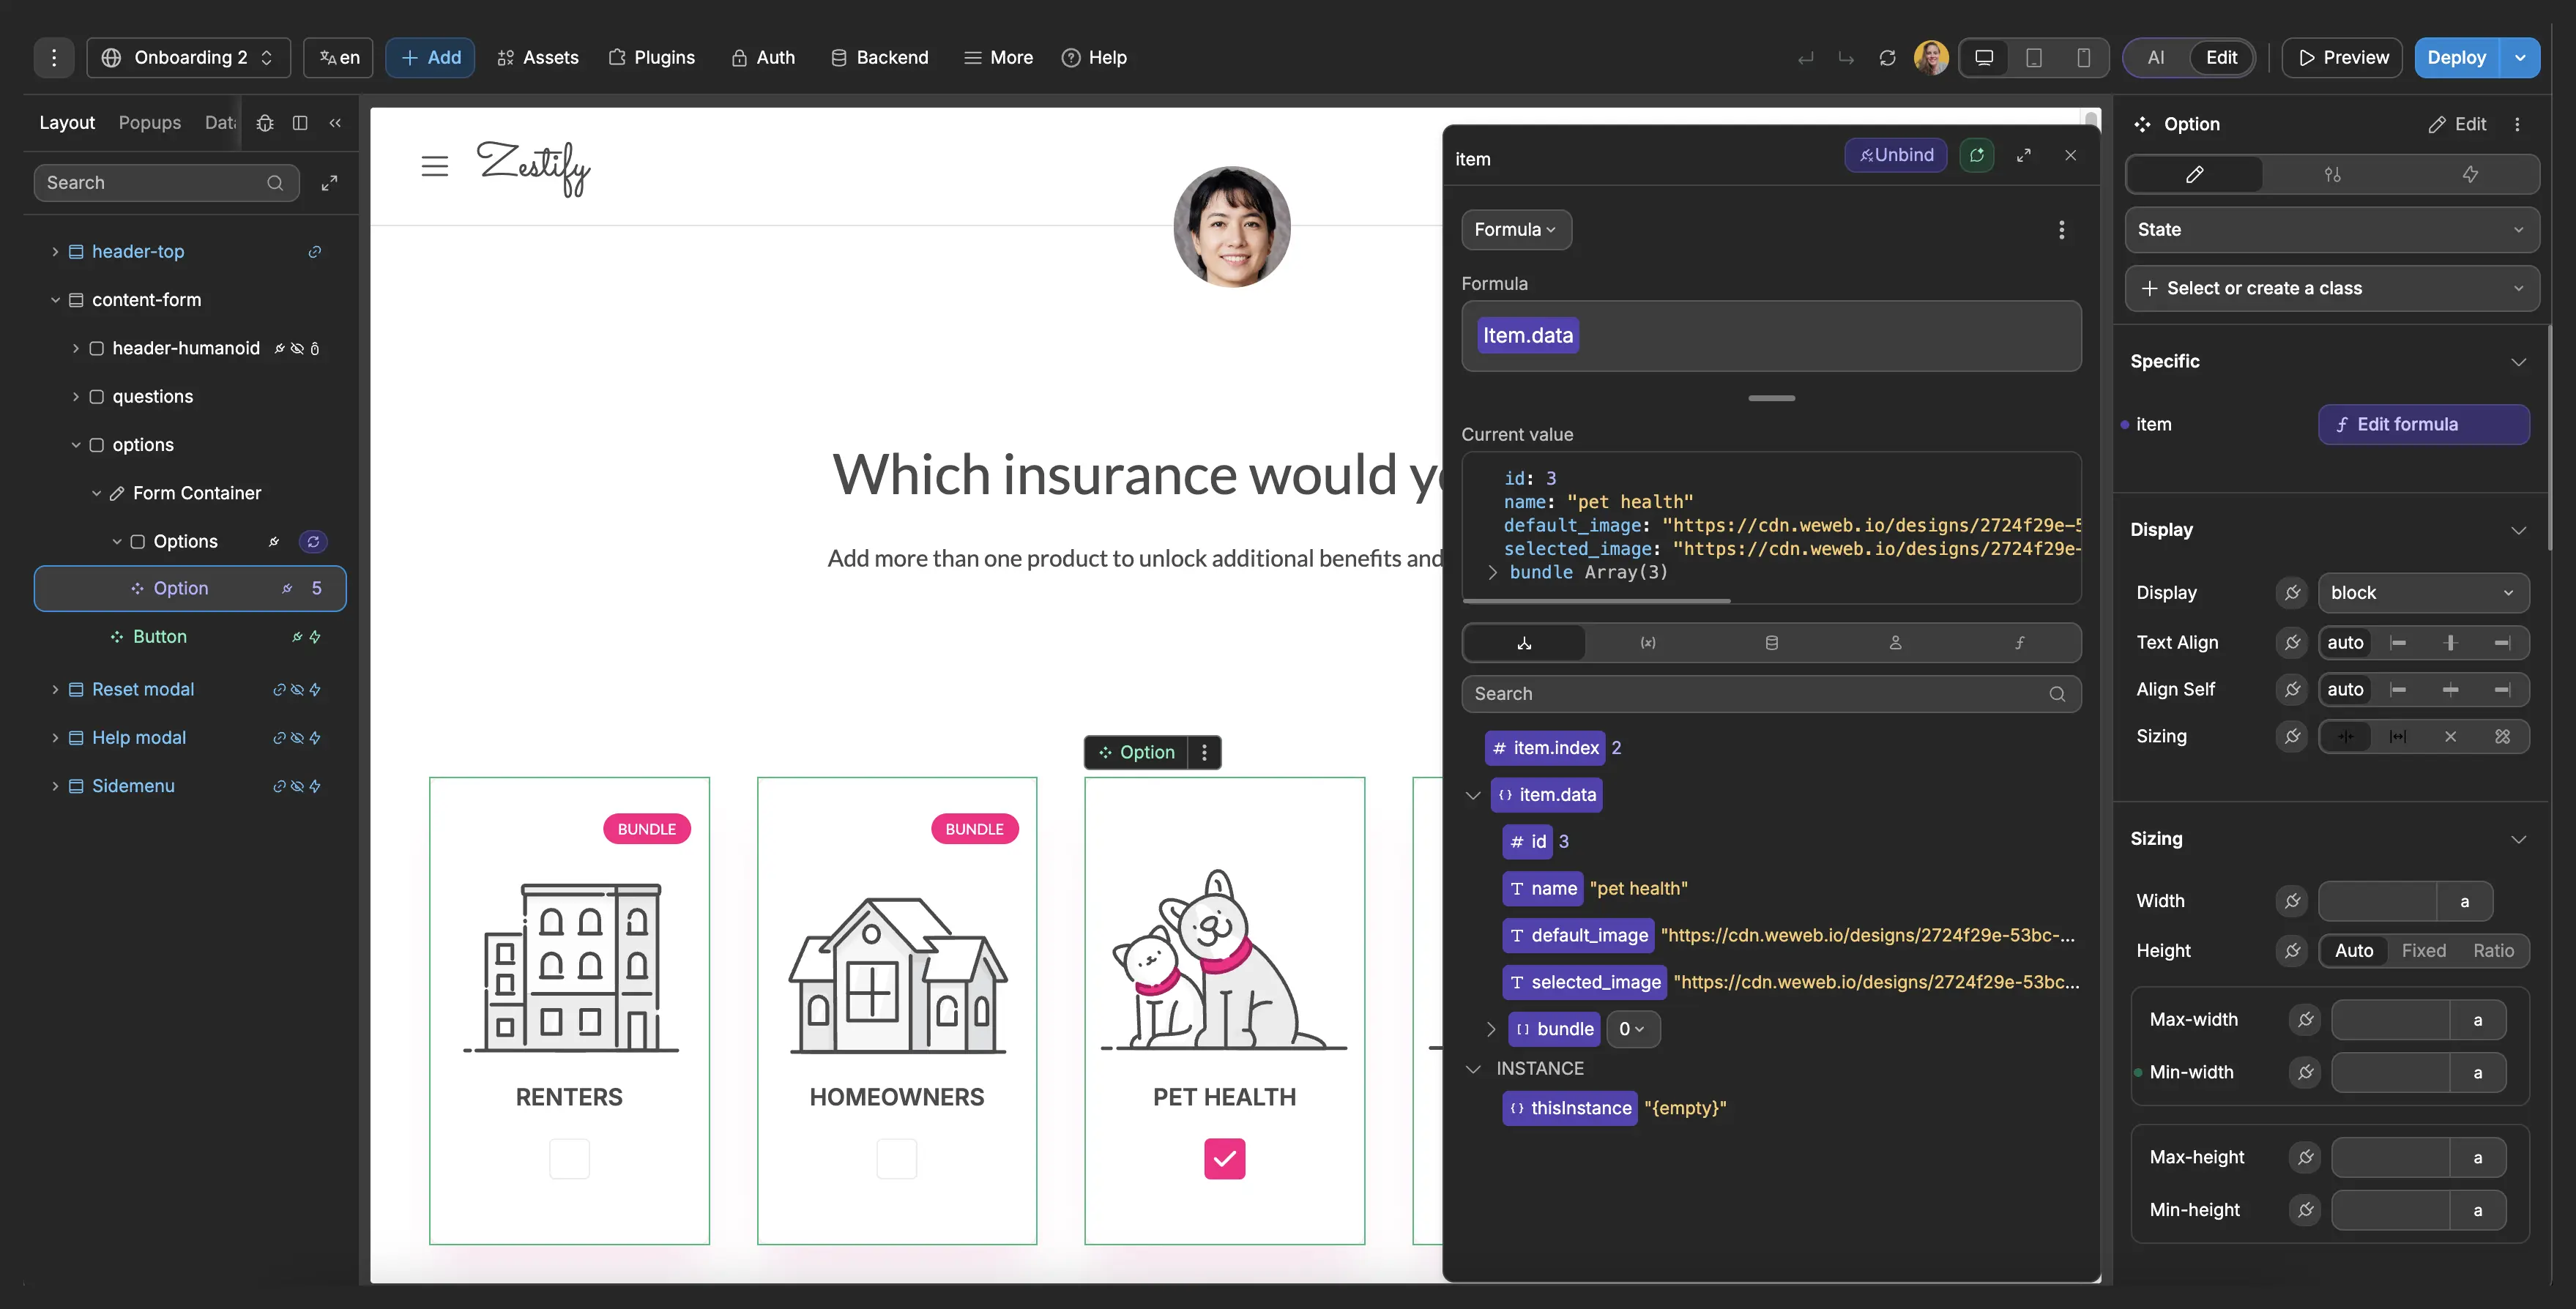
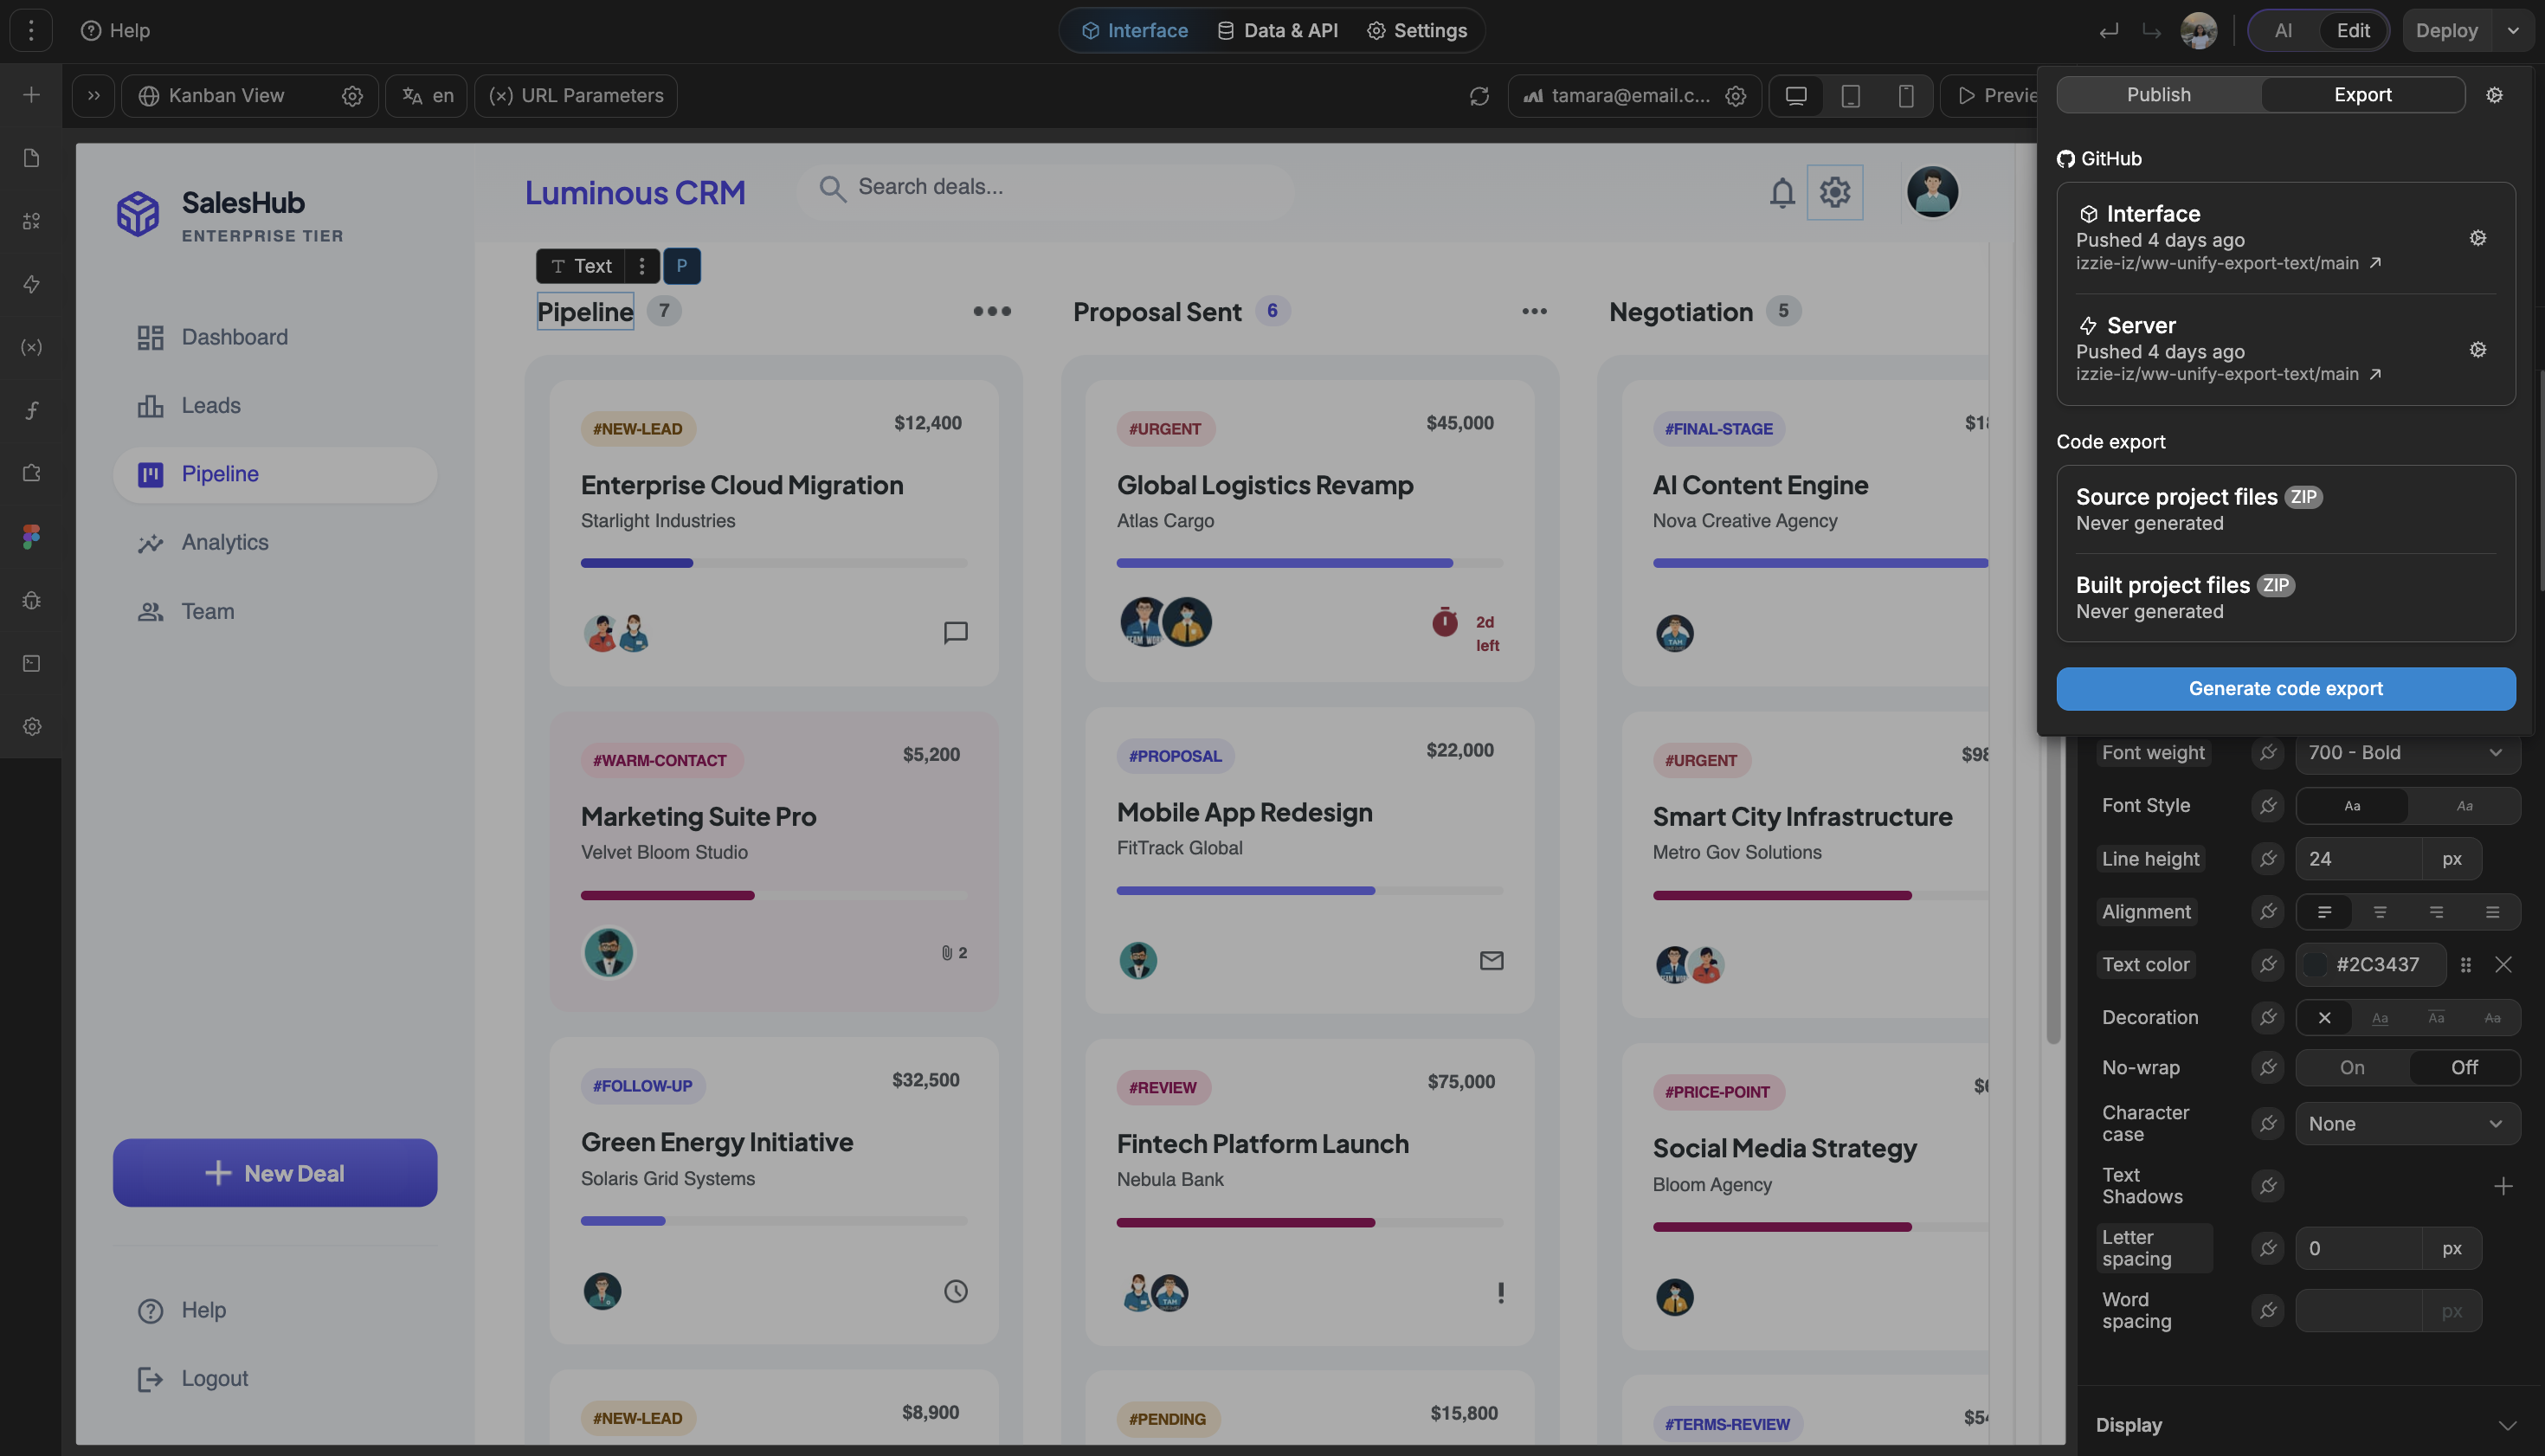
Build dashboards that feel native to your app
The standards of code, with no-code.
Move from BI workaround to product-ready dashboard


" It used to take a frontend developer, a backend developer, and a project manager. With WeWeb, I can build a new feature in about 90 minutes. I just get it done between meetings. "

FAQs
A drag and drop dashboard builder lets you create KPI views, charts, tables, filters, and reporting pages visually, without building every screen from scratch in code.
The hard part is not placing a chart on a page. It is connecting the right data sources, shaping the data safely, handling permissions, and making the dashboard feel like part of your product.
With WeWeb, you can build dashboards visually, connect to your backend or APIs, and design reporting experiences for internal teams, customers, partners, or tenants.
Yes. WeWeb is well suited for customer-facing dashboards because you can control the interface, layout, branding, filters, and workflows instead of embedding a generic BI tool into your app.
You can build tenant dashboards, client portals, analytics pages, account health views, usage dashboards, and operational reporting screens that match the rest of your product.
For customer-facing data, keep security in the backend. Use authenticated API access, backend-enforced permissions, row-level security, and tenant-aware queries so each user only receives data they are allowed to see.
You can connect dashboards to WeWeb Tables, Supabase, Xano, Airtable, Google Sheets, REST APIs, GraphQL endpoints, SOAP APIs, or custom backend services.
This makes WeWeb useful when dashboard data lives across multiple systems: product databases, CRM records, billing tools, support platforms, event streams, warehouse views, or internal APIs.
You can bring the data into one visual interface, then add KPI cards, charts, data tables, saved filters, drilldowns, exports, and role-based dashboard views around it.
Start with a clear data model and a few dashboard roles: admin, manager, customer, team member, partner, or any structure your app needs. Then decide which metrics, filters, records, and exports each role should access.
In WeWeb, you can design different dashboard experiences for different users, reuse components, and keep reporting pages consistent as your app grows.
Permissions should be enforced by your backend, database policies, and authenticated APIs, not by hiding UI elements alone. WeWeb gives you the interface layer, while your backend should control what data is returned.
