


In today’s fast paced real estate market, gut feelings no longer cut it. Winning property managers, asset owners, and real estate investors rely on data to make smarter, faster decisions. In fact, studies show that companies employing data-driven approaches are 19 times more likely to be profitable and six times as likely to retain customers. This is where property dashboards come in. A property dashboard is a visual interface that centralizes key performance indicators (KPIs) and data points from across your portfolio into one easy to understand screen. It transforms complex spreadsheets and siloed information into actionable insights, giving you a real time command center for your assets. From tracking rent collection and occupancy rates to monitoring maintenance requests and financial performance, these tools are essential for optimizing operations and maximizing returns.
How Dashboards Drive Smarter Decisions Across Roles
Property dashboards are not just for high level executives. Their value permeates every level of a real estate organization, empowering different roles with tailored insights.
Real Time Visibility Into Portfolio and Operations
The most significant advantage of modern property dashboards is access to real time information. Static monthly reports are a thing of the past. The ability to see what is happening right now is a game changer for proactive management. The growth of the PropTech (Property Technology) market, which is expected to grow from $35.4 billion in 2024 to $114.8 billion by 2033, underscores this industry-wide shift.
With live data feeds, you can monitor critical operational aspects as they happen. Is a particular building experiencing an unusual spike in maintenance requests? Are occupancy rates in a specific submarket suddenly dipping? Real time dashboards provide early warnings that allow teams to react swiftly. For example, a sudden drop in online rent payments could signal a problem with the payment portal, which can be immediately investigated. This level of visibility transforms property management from a reactive to a proactive discipline, improving efficiency and tenant satisfaction.
Data Foundations and Integrations
A dashboard is only as good as the data it displays. That’s why the foundation of effective property dashboards lies in solid data management and seamless integrations. The goal is to create a single source of truth by connecting all the disparate software systems used to manage a portfolio. Eliminating manual data entry is critical, as automation can reduce administrative costs and human errors that impact Net Operating Income (NOI).
A powerful dashboard should integrate with key systems including:
By unifying these data sources, you eliminate manual data entry, reduce the risk of human error, and ensure that your property dashboards present a complete and accurate picture of your portfolio.
Core Capabilities of Modern Property Dashboards
While all property dashboards aim to visualize data, the most effective solutions offer a specific set of core capabilities that enable true insight and customization.
Key Features to Look For:
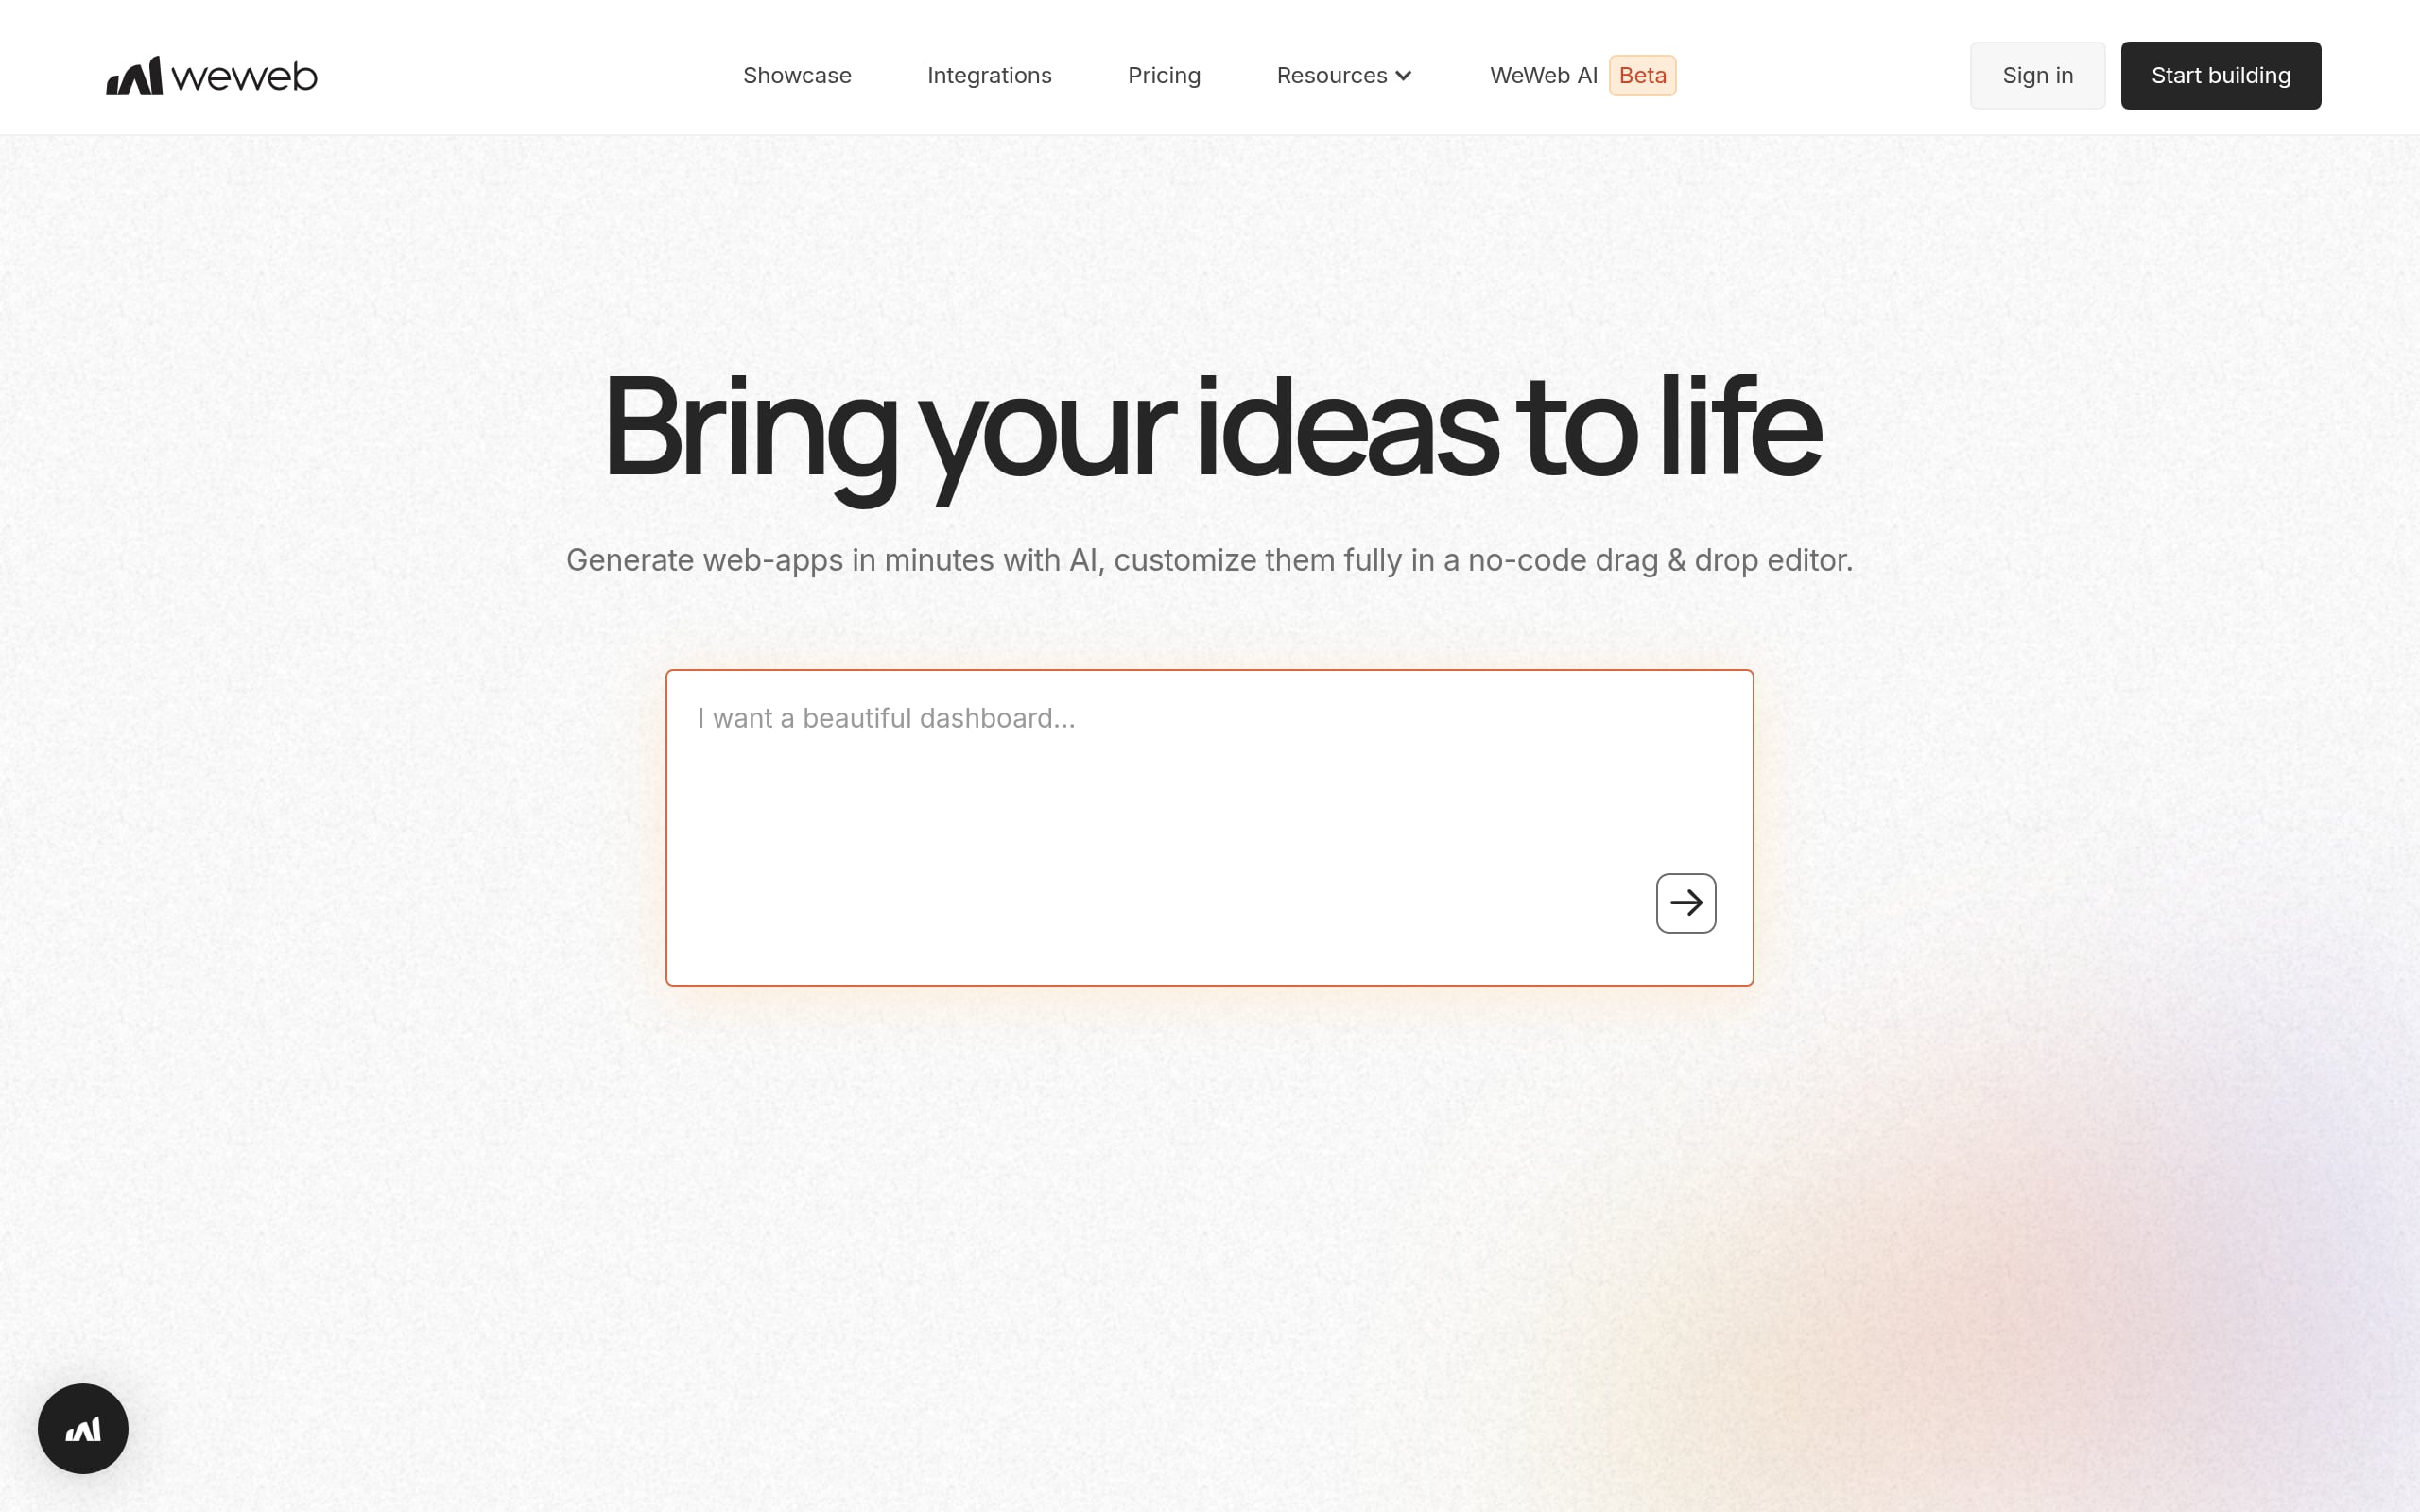
Building a tool with this level of specificity often requires a flexible platform. For teams that need complete control over their data and interface, creating custom property dashboards with a visual development platform like WeWeb allows you to build exactly what you need without being limited by off the shelf software.
Advanced Analytics: From Descriptive to Predictive
Truly advanced property dashboards go beyond simply showing you what happened (descriptive analytics). They help you understand why it happened (diagnostic analytics) and what is likely to happen next (predictive analytics), often powered by AI.
This evolution from rearview mirror reporting to forward looking insight is where the most value is unlocked. For instance, instead of just reporting on current vacancy rates, a predictive dashboard might analyze historical data, market trends, and seasonality to forecast future vacancies. This allows managers to adjust marketing spend and leasing strategies proactively to minimize downtime. Similarly, analyzing maintenance data can predict when major equipment like an HVAC unit is likely to fail, enabling preventative maintenance that avoids costly emergency repairs and tenant disruption. Using analytics to shift from reactive to proactive maintenance can reduce maintenance costs by up to 30% and equipment downtime by 45%. Some studies even show that implementing predictive analytics can yield a tenfold return on investment.
Architecture for Scale, Security, and Governance
For any serious real estate business, especially at the enterprise level, the underlying architecture of your property dashboards is critically important. As your portfolio grows, your solution needs to scale with it without compromising performance.
Security is paramount. You are handling sensitive financial and tenant data, so the platform must adhere to the highest security standards, including data encryption and secure login protocols. For companies with specific compliance needs, the ability to self host the application on a private server or cloud instance provides an essential layer of control.
This is another area where building a custom application shines. Platforms like WeWeb offer the backend freedom and self hosting options that enterprises require, ensuring that your property dashboards meet strict security and governance policies.
Top 9 Property Dashboards
Navigating the complexities of real estate management requires specialized tools that consolidate vast amounts of data into actionable insights. This selection of top property dashboards highlights essential platforms designed to streamline operations, from financial tracking to maintenance scheduling, ensuring that managers have a clear view of their entire portfolio health. By centralizing these diverse metrics, professionals can make more informed decisions that drive efficiency and long-term growth. For inspiration, explore real apps teams have shipped in our showcase.
1. Property Management Dashboard
A Property Management Dashboard is the operational and financial cockpit for property, asset, and regional managers. It unifies portfolio health across occupancy, leasing pipelines, rent roll, collections, maintenance, and budgets, eliminating data silos between PMS and accounting, lagging monthly reports, and risky manual consolidations. With one living source of truth, blind spots in cash flow, unit turns, or vendor compliance surface before they swell into costly problems.
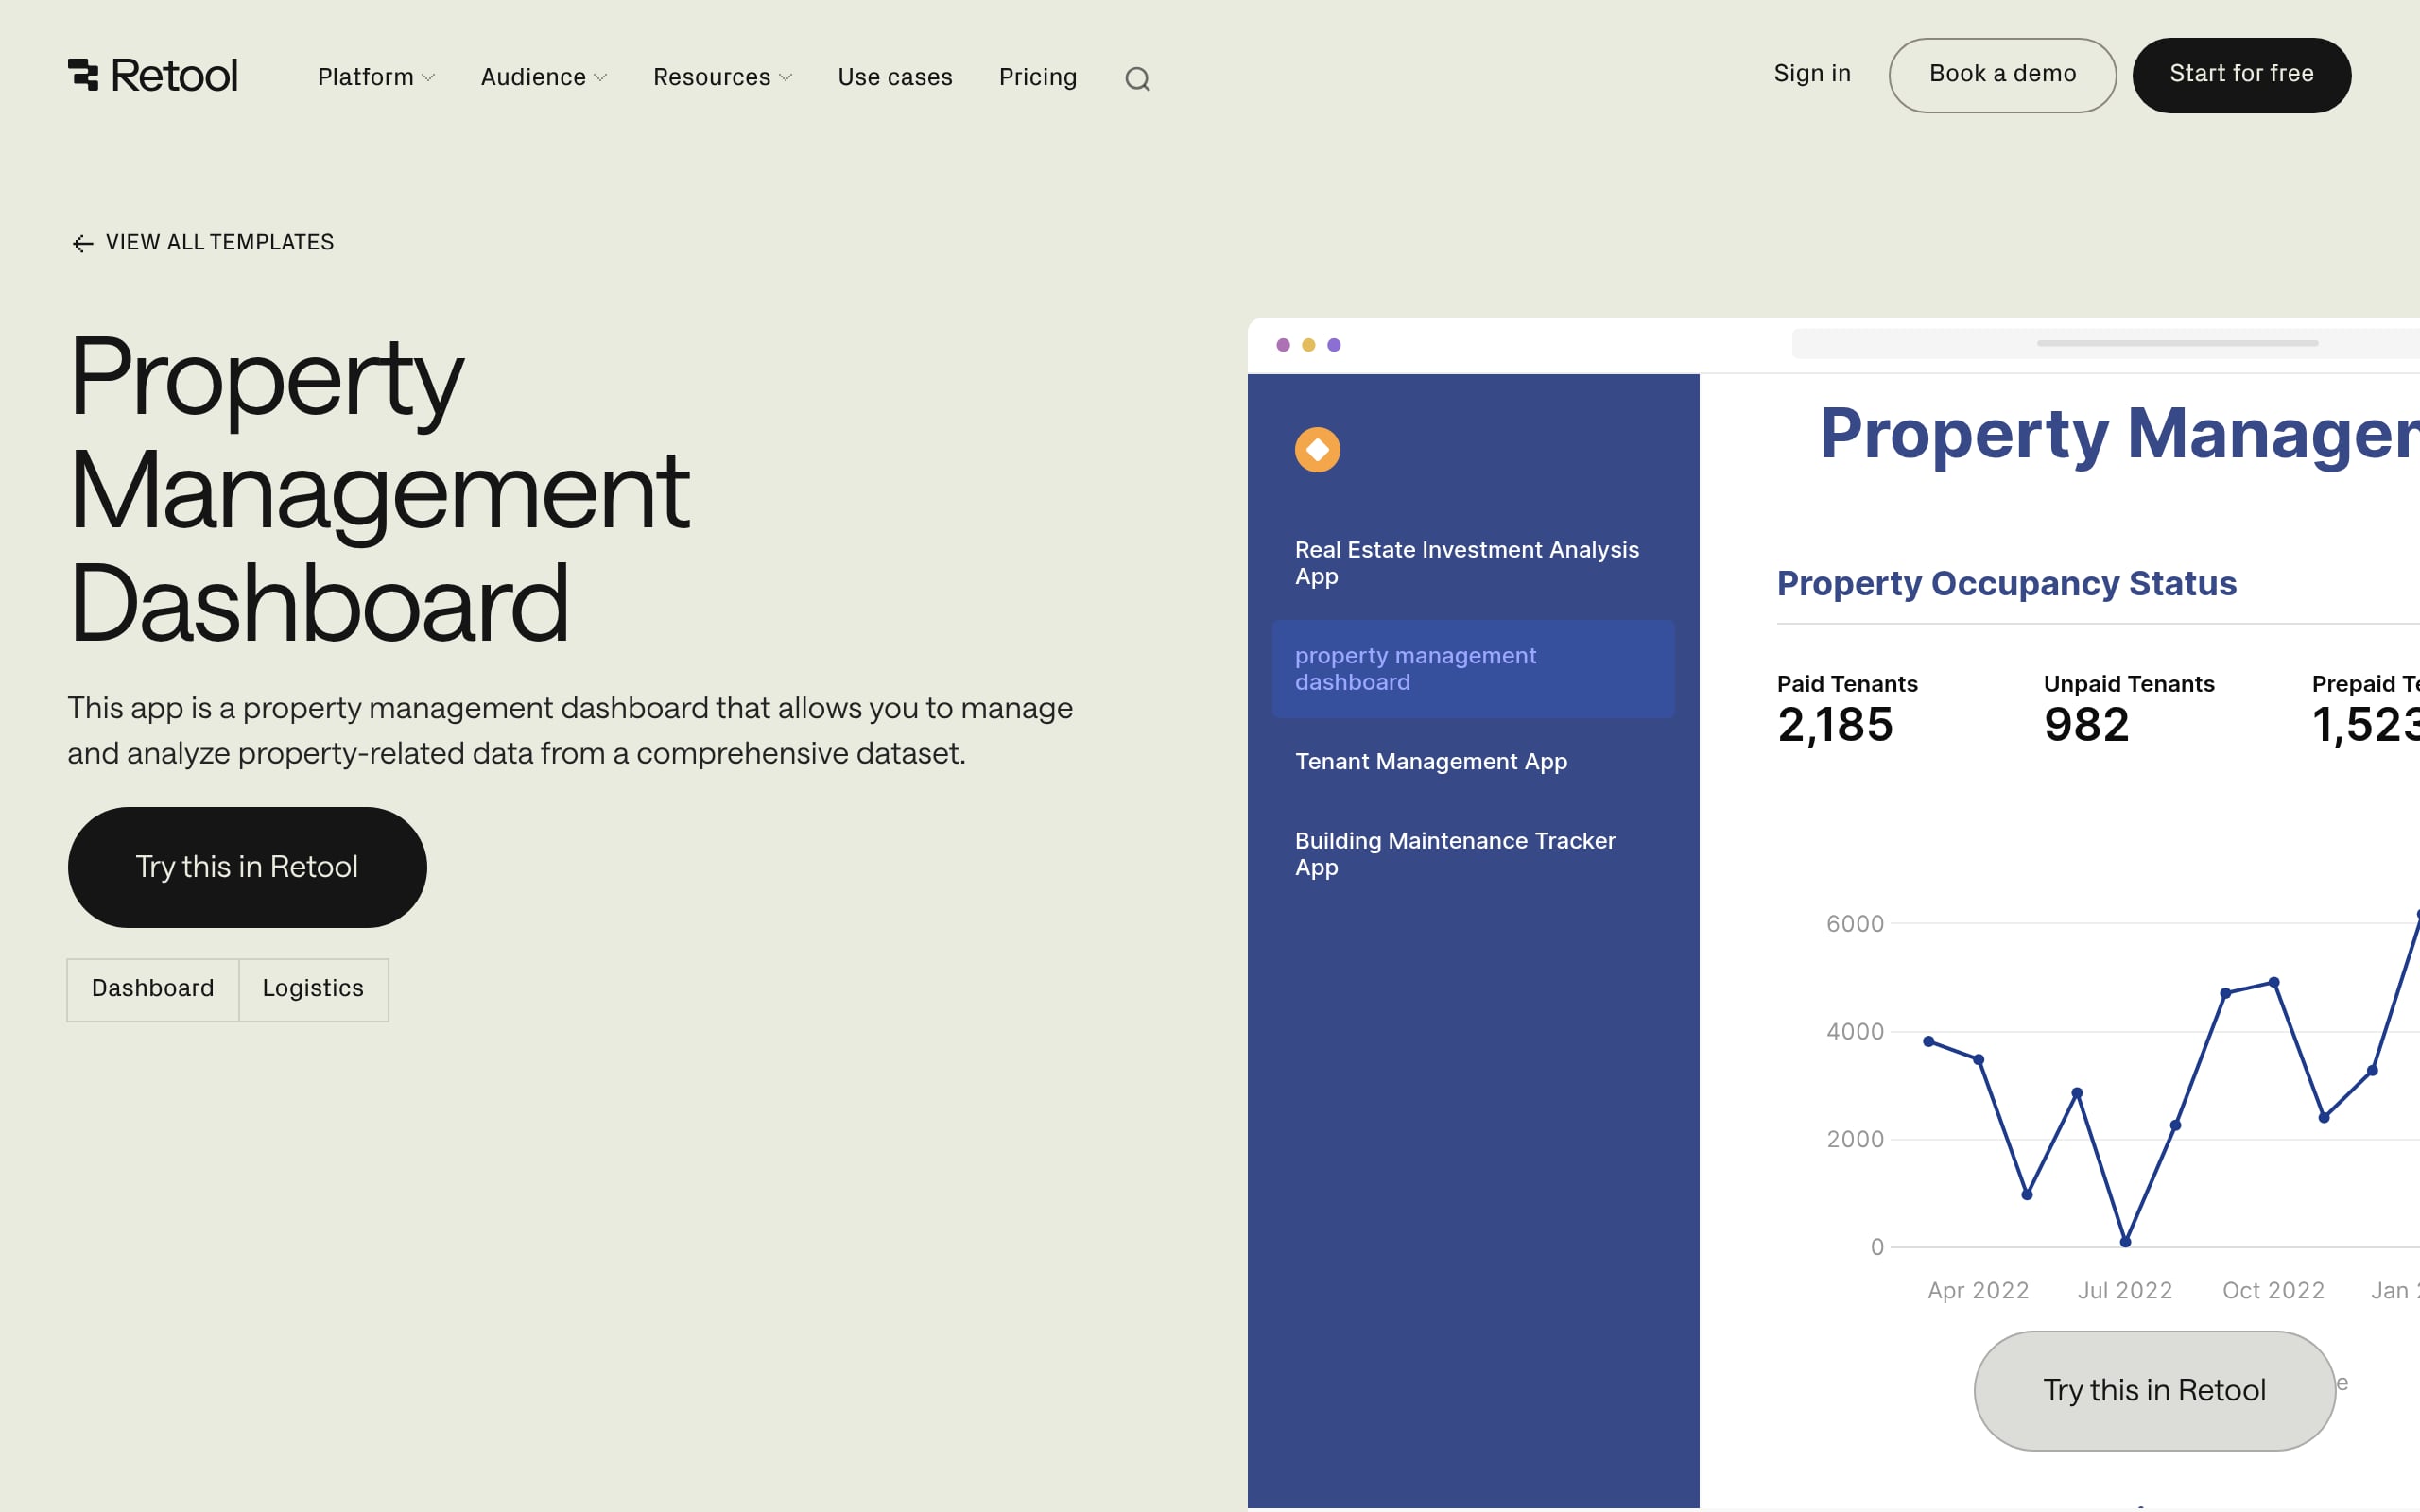
Why it matters: Decisions on pricing, renewals, work-order triage, and capex timing move from guesswork to evidence. Expect tighter vacancy cycles, lower bad debt via proactive alerts, and disciplined opex control. This lifts NOI, occupancy, and resident satisfaction while keeping teams aligned and compliant.
Signals to watch:
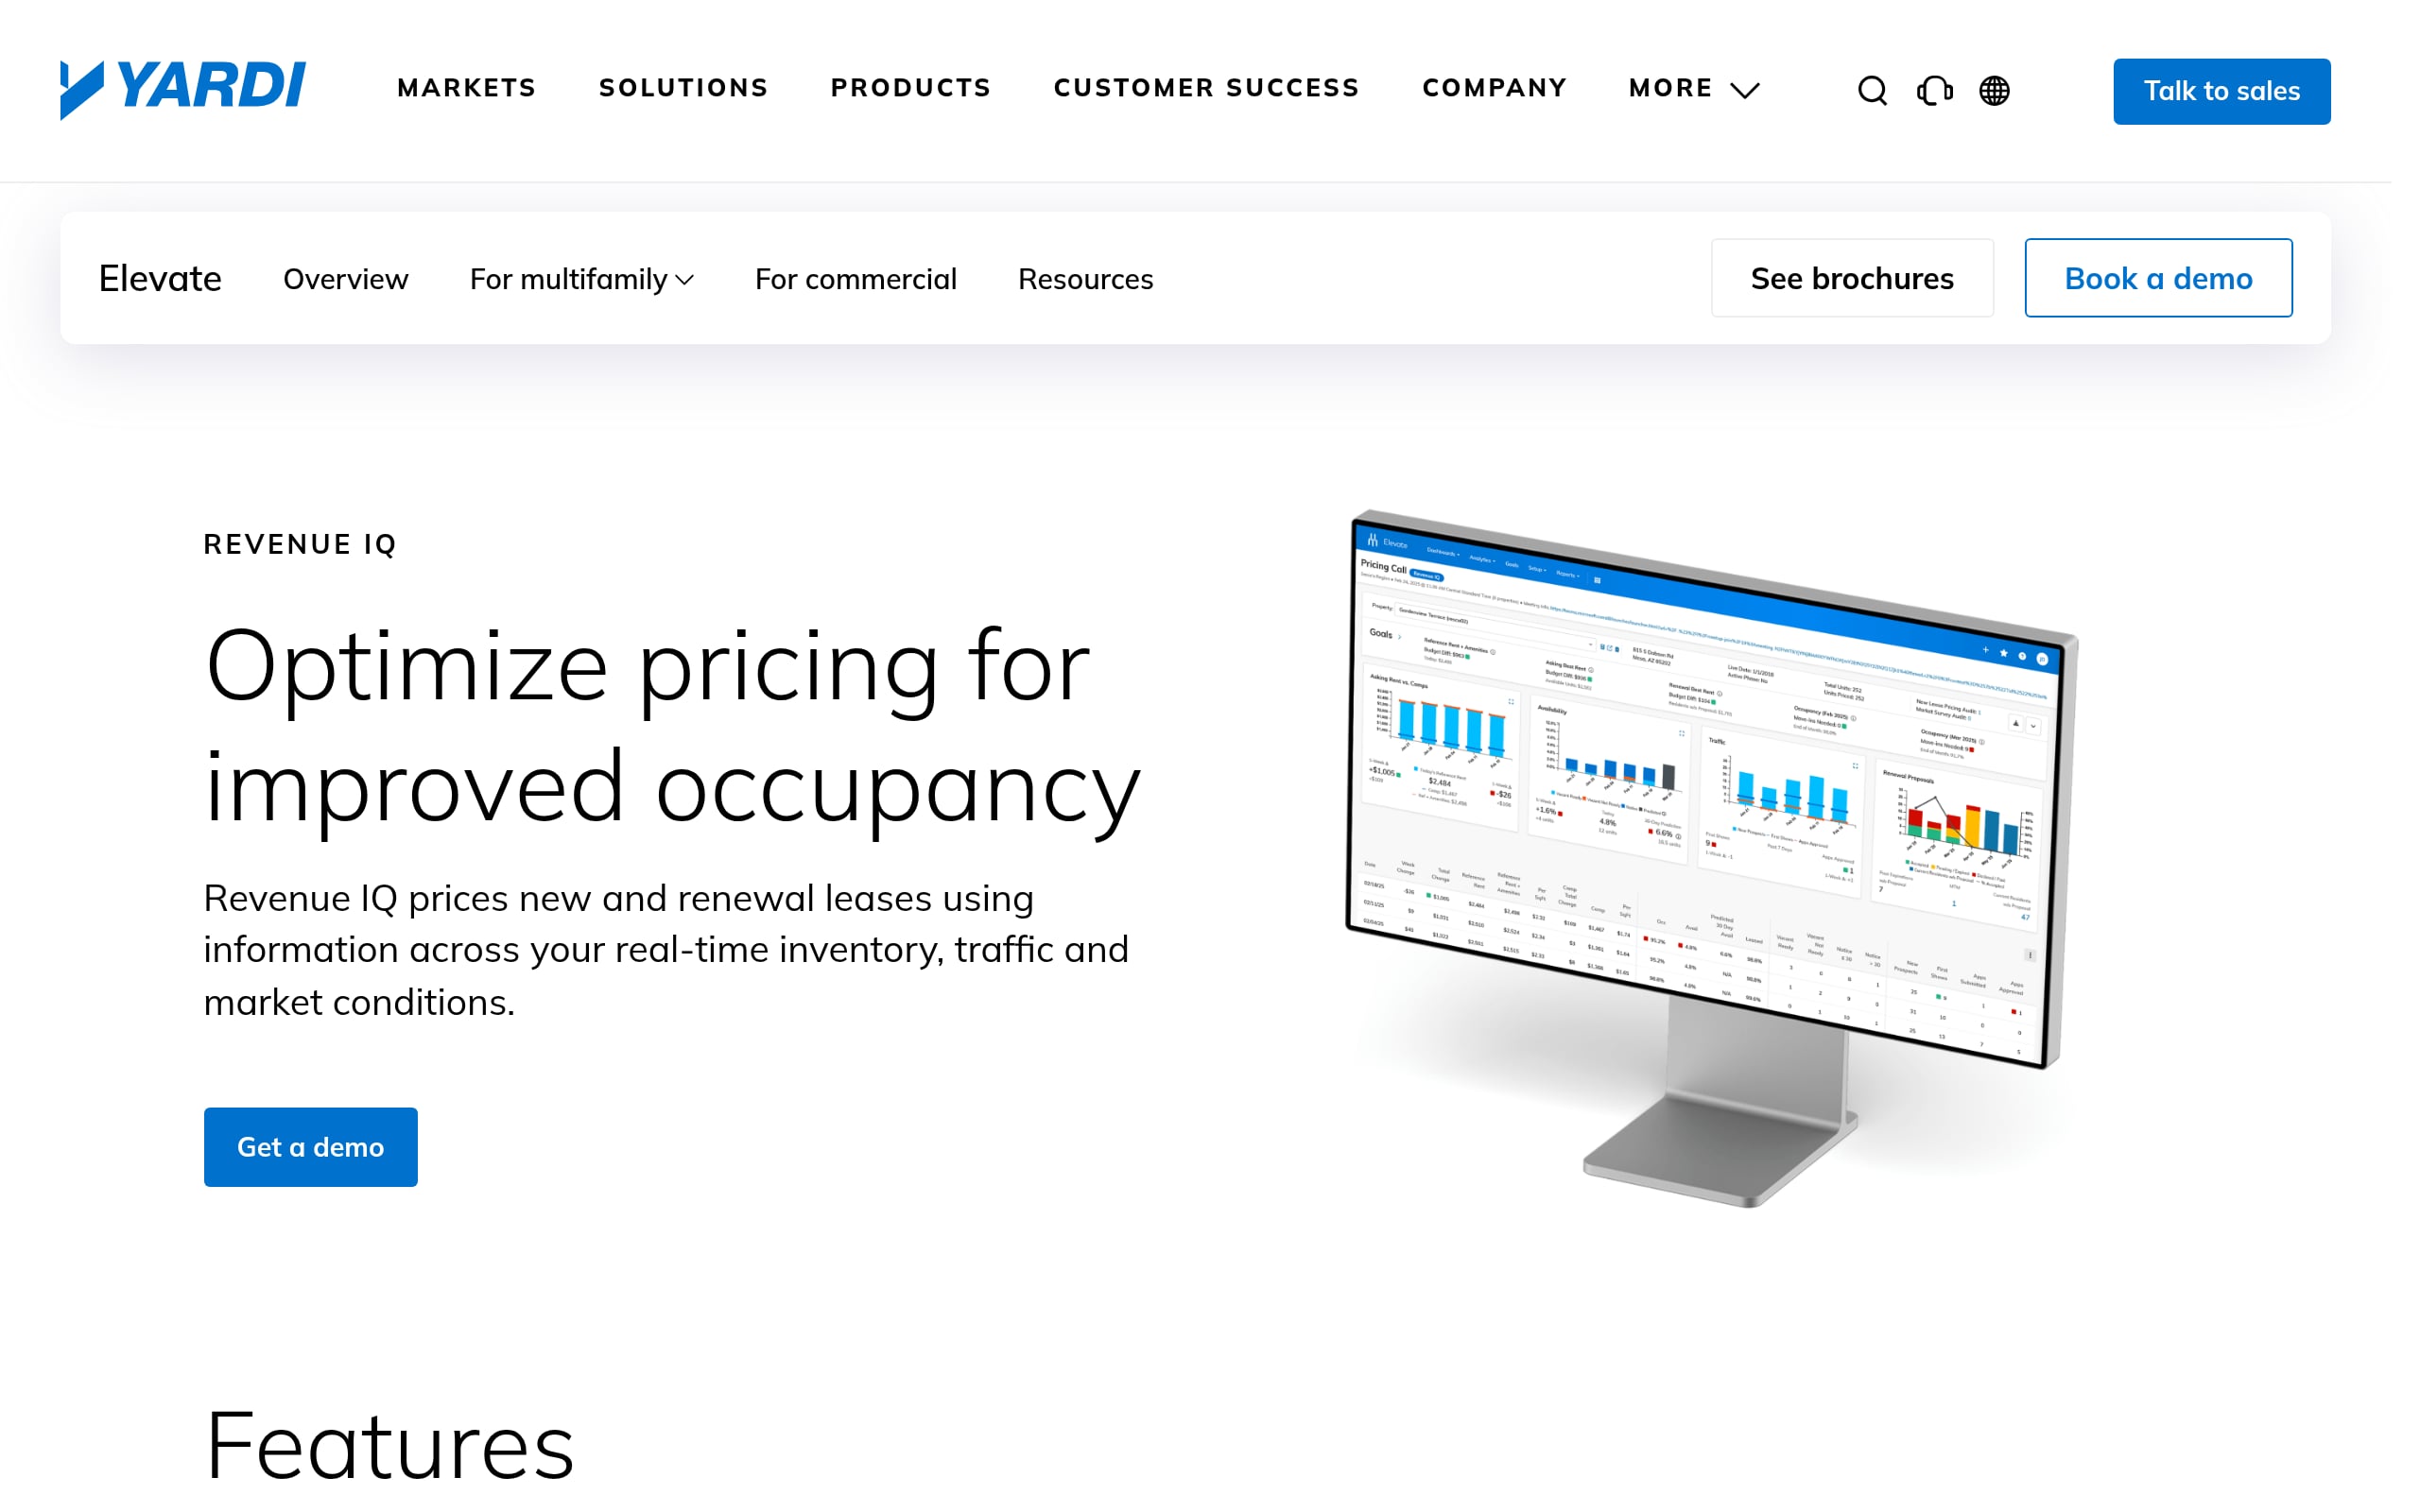
Data sources & WeWeb build notes: Pull from PMS (Yardi, AppFolio), CRM, and accounting. In WeWeb, expose data via a unified REST/GraphQL layer that handles joins and caching. Enforce RBAC and row-level security at the database/API. Use custom Vue components for complex charts or maps, and paginate heavy tables for speed.
2. Real Estate Portfolio Dashboard
For executives, asset managers, and finance leaders, this dashboard centralizes performance across every property (including revenue, expenses, occupancy, and cash flow), replacing slow, manual Excel rollups with a living portfolio narrative. It standardizes definitions, smooths out data fragmentation, and presents a clean, comparable snapshot of health, risk, and efficiency that scales from asset to fund.
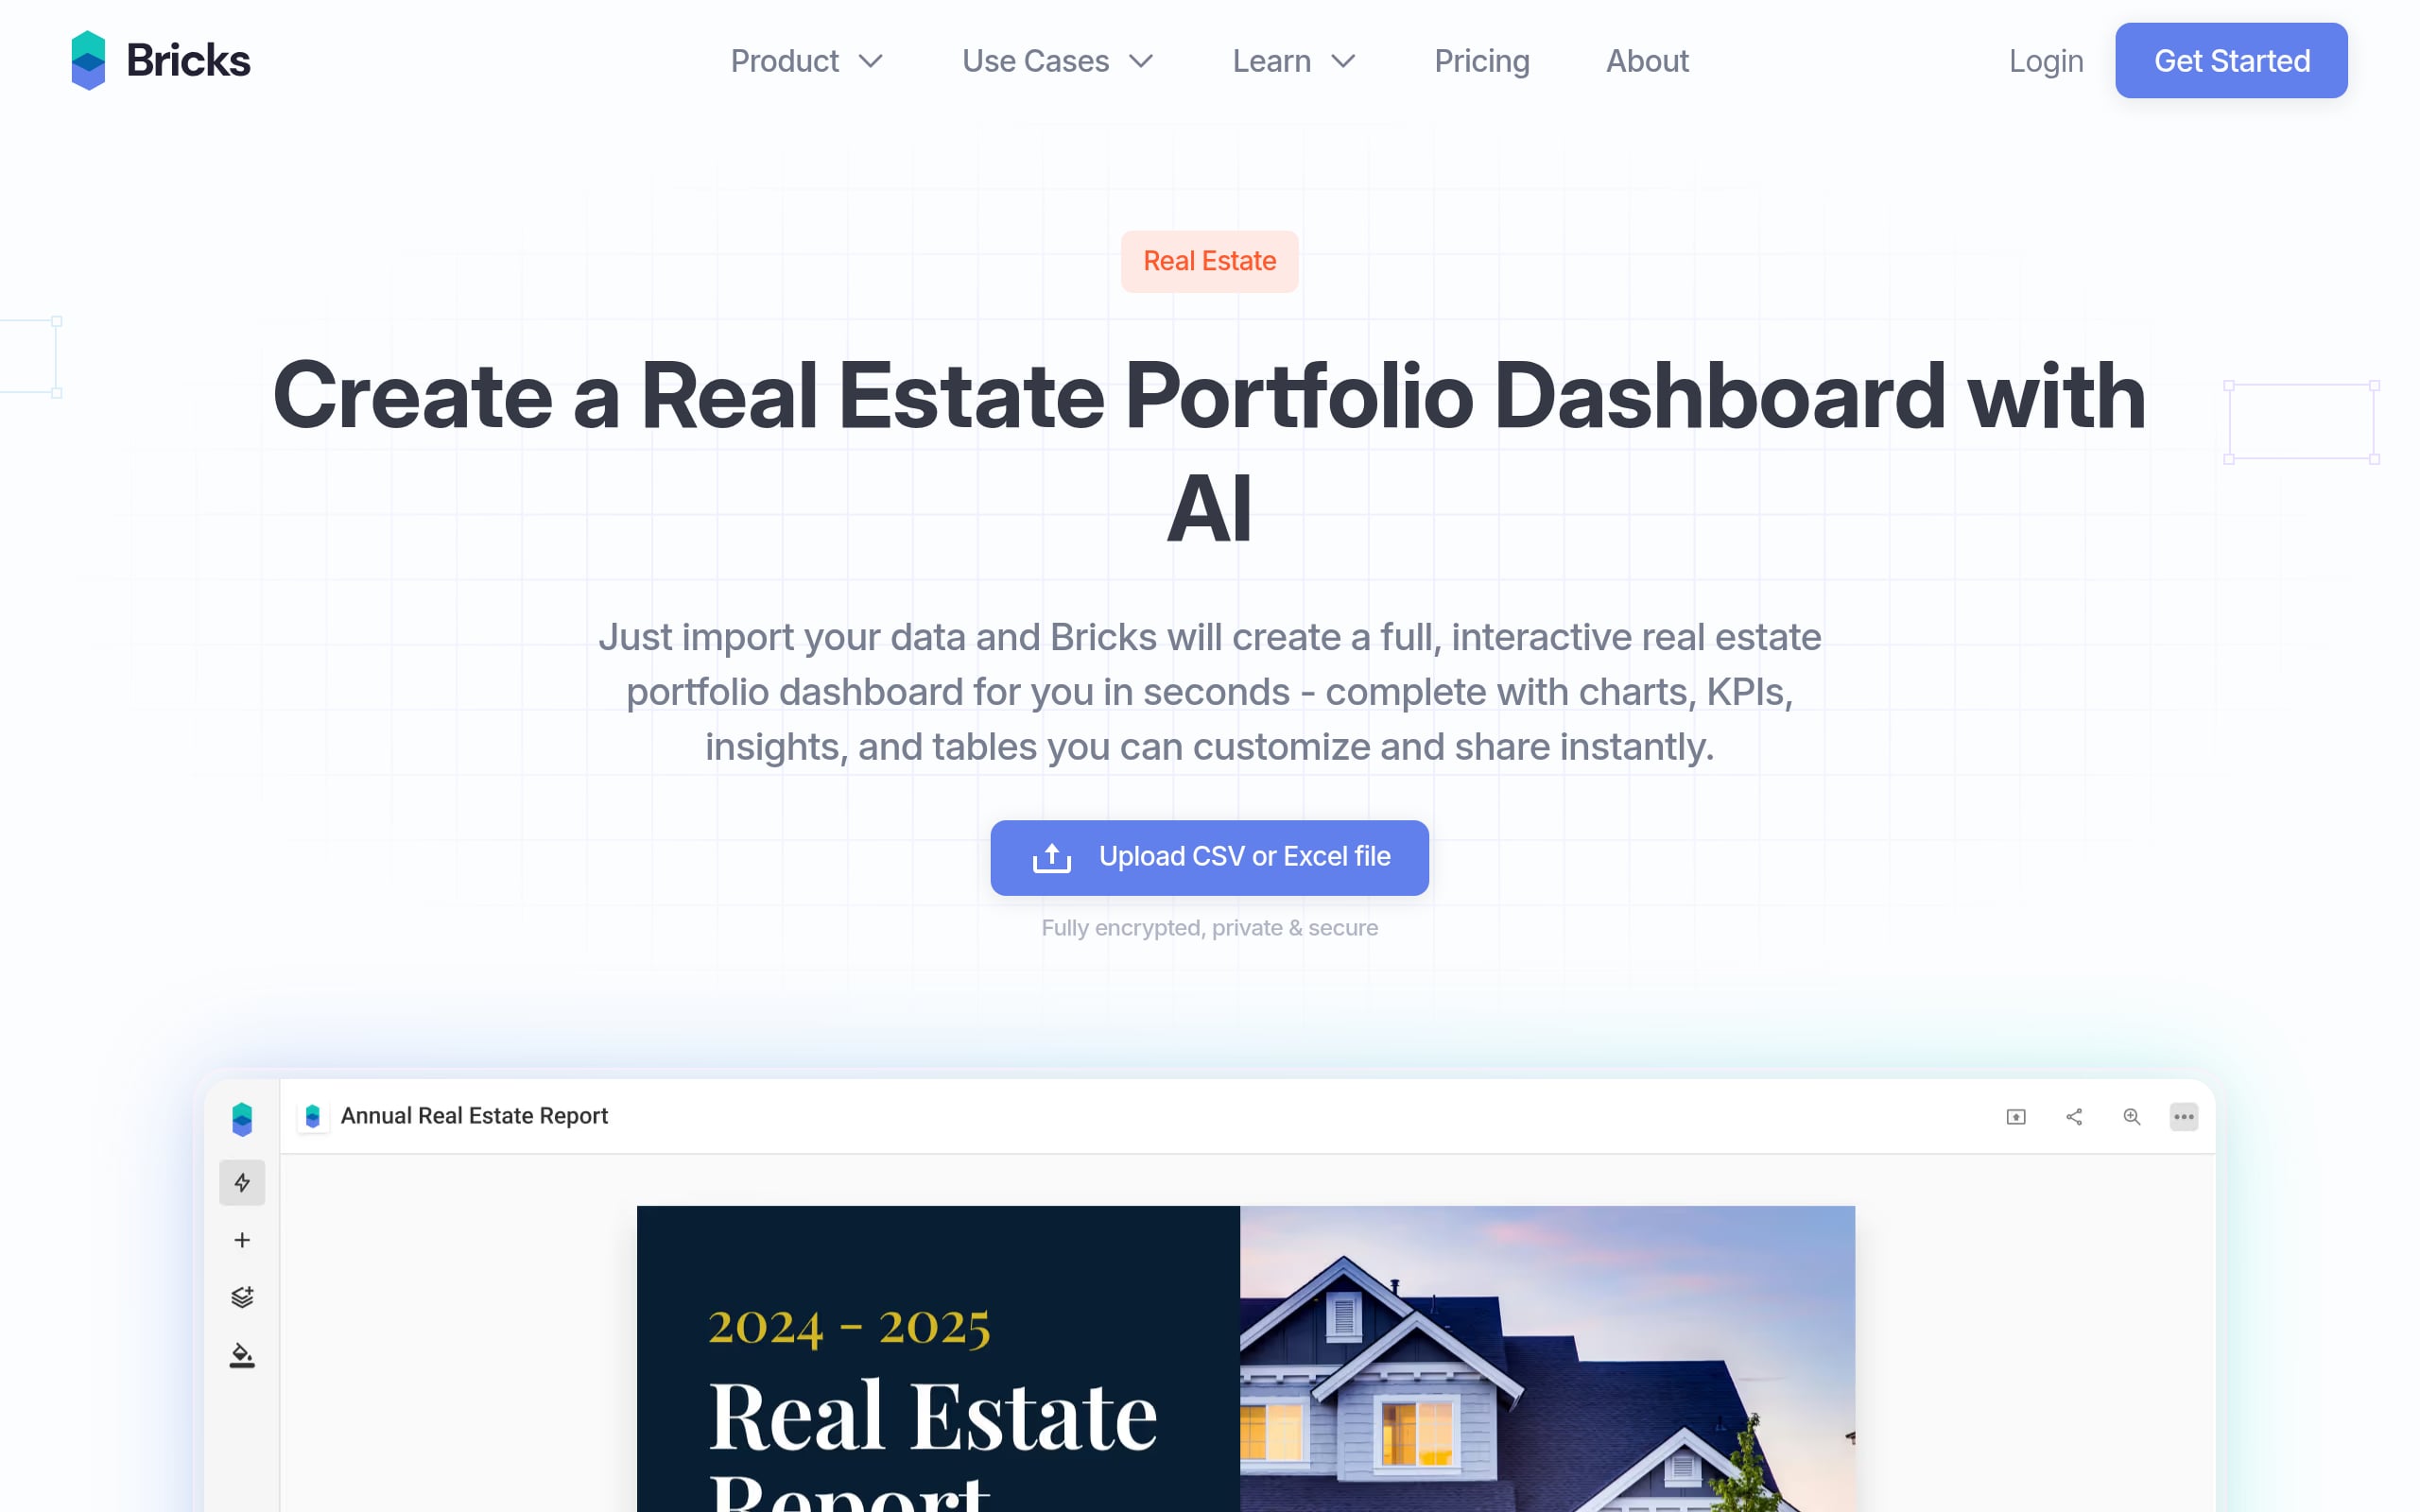
Why it matters: Capital allocation, pricing, and risk calls happen in hours, not weeks. Expect tighter expense discipline, clearer cash predictability, and early reads on leading indicators like leasing velocity and covenant headroom. This ultimately sharpens NOI and decision confidence.
Signals to watch:
Data sources & WeWeb build notes: Connect PMS/accounting (Yardi, RealPage) and CRM (VTS) via a secure REST/GraphQL API. In WeWeb, implement RBAC and row-level security to scope by user/property. Pre-aggregate KPIs in the backend, and render advanced visuals with custom Vue components.
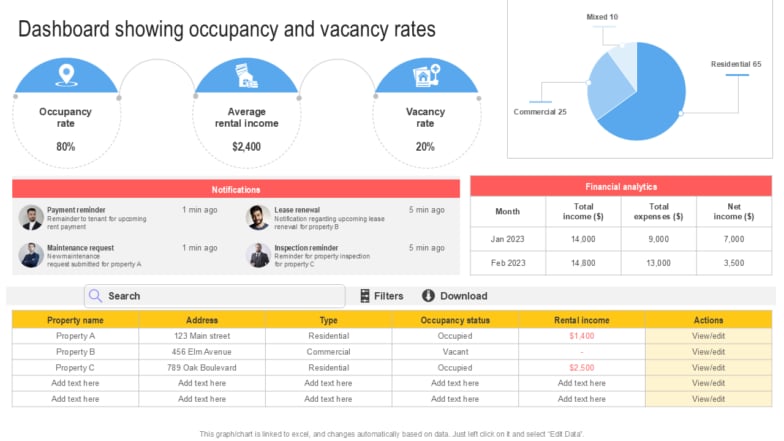
3. Occupancy & Leasing Dashboard
Designed for property managers, asset managers, and leadership, this dashboard delivers a single source of truth for unit availability, leasing velocity, renewal capture, and forward exposure. It fuses PMS and CRM data to spotlight aging vacancies, stalled applications, and make-ready bottlenecks, stopping revenue leakage before it hits the P&L.
Why it matters: Teams can tune pricing and concessions daily, target high-risk units, and compress turn times. Results follow quickly, including reduced vacancy loss, stronger lead-to-lease conversion, and a steadier occupancy outlook without end‑of‑month surprises.
Signals to watch:
Data sources & WeWeb build notes: Pull from PMS, leasing CRM, and accounting. Connect via REST or direct SQL; use Supabase for auth with RBAC and row-level security. Visualize trends with the Chart.js plugin and add custom Vue components for bespoke UI; enable pagination and server-side filtering for speed.
4. Rent Pricing & Revenue Dashboard
Built for revenue, asset, and property managers, this dashboard centralizes asking and achieved rents, occupancy, concessions, and collections to guide daily pricing. It replaces spreadsheet-driven cycles with live, standardized views of loss-to-lease, demand signals, and upcoming exposure, so pricing strategy adapts to reality, not last week’s recap.
Why it matters: Align prices with demand, compress loss-to-lease, and capture more renewals. Same-day pricing decisions bring earlier warnings on budget variance and create executive-to-site alignment around one source of truth.
Signals to watch:
Data sources & WeWeb build notes: Combine PMS (Yardi, RealPage), revenue management, and accounting/GL via a secure REST/GraphQL layer. In WeWeb, implement RBAC and API-level row security so users only see approved properties. Cache heavy queries and use custom Vue charts for pricing waterfalls.
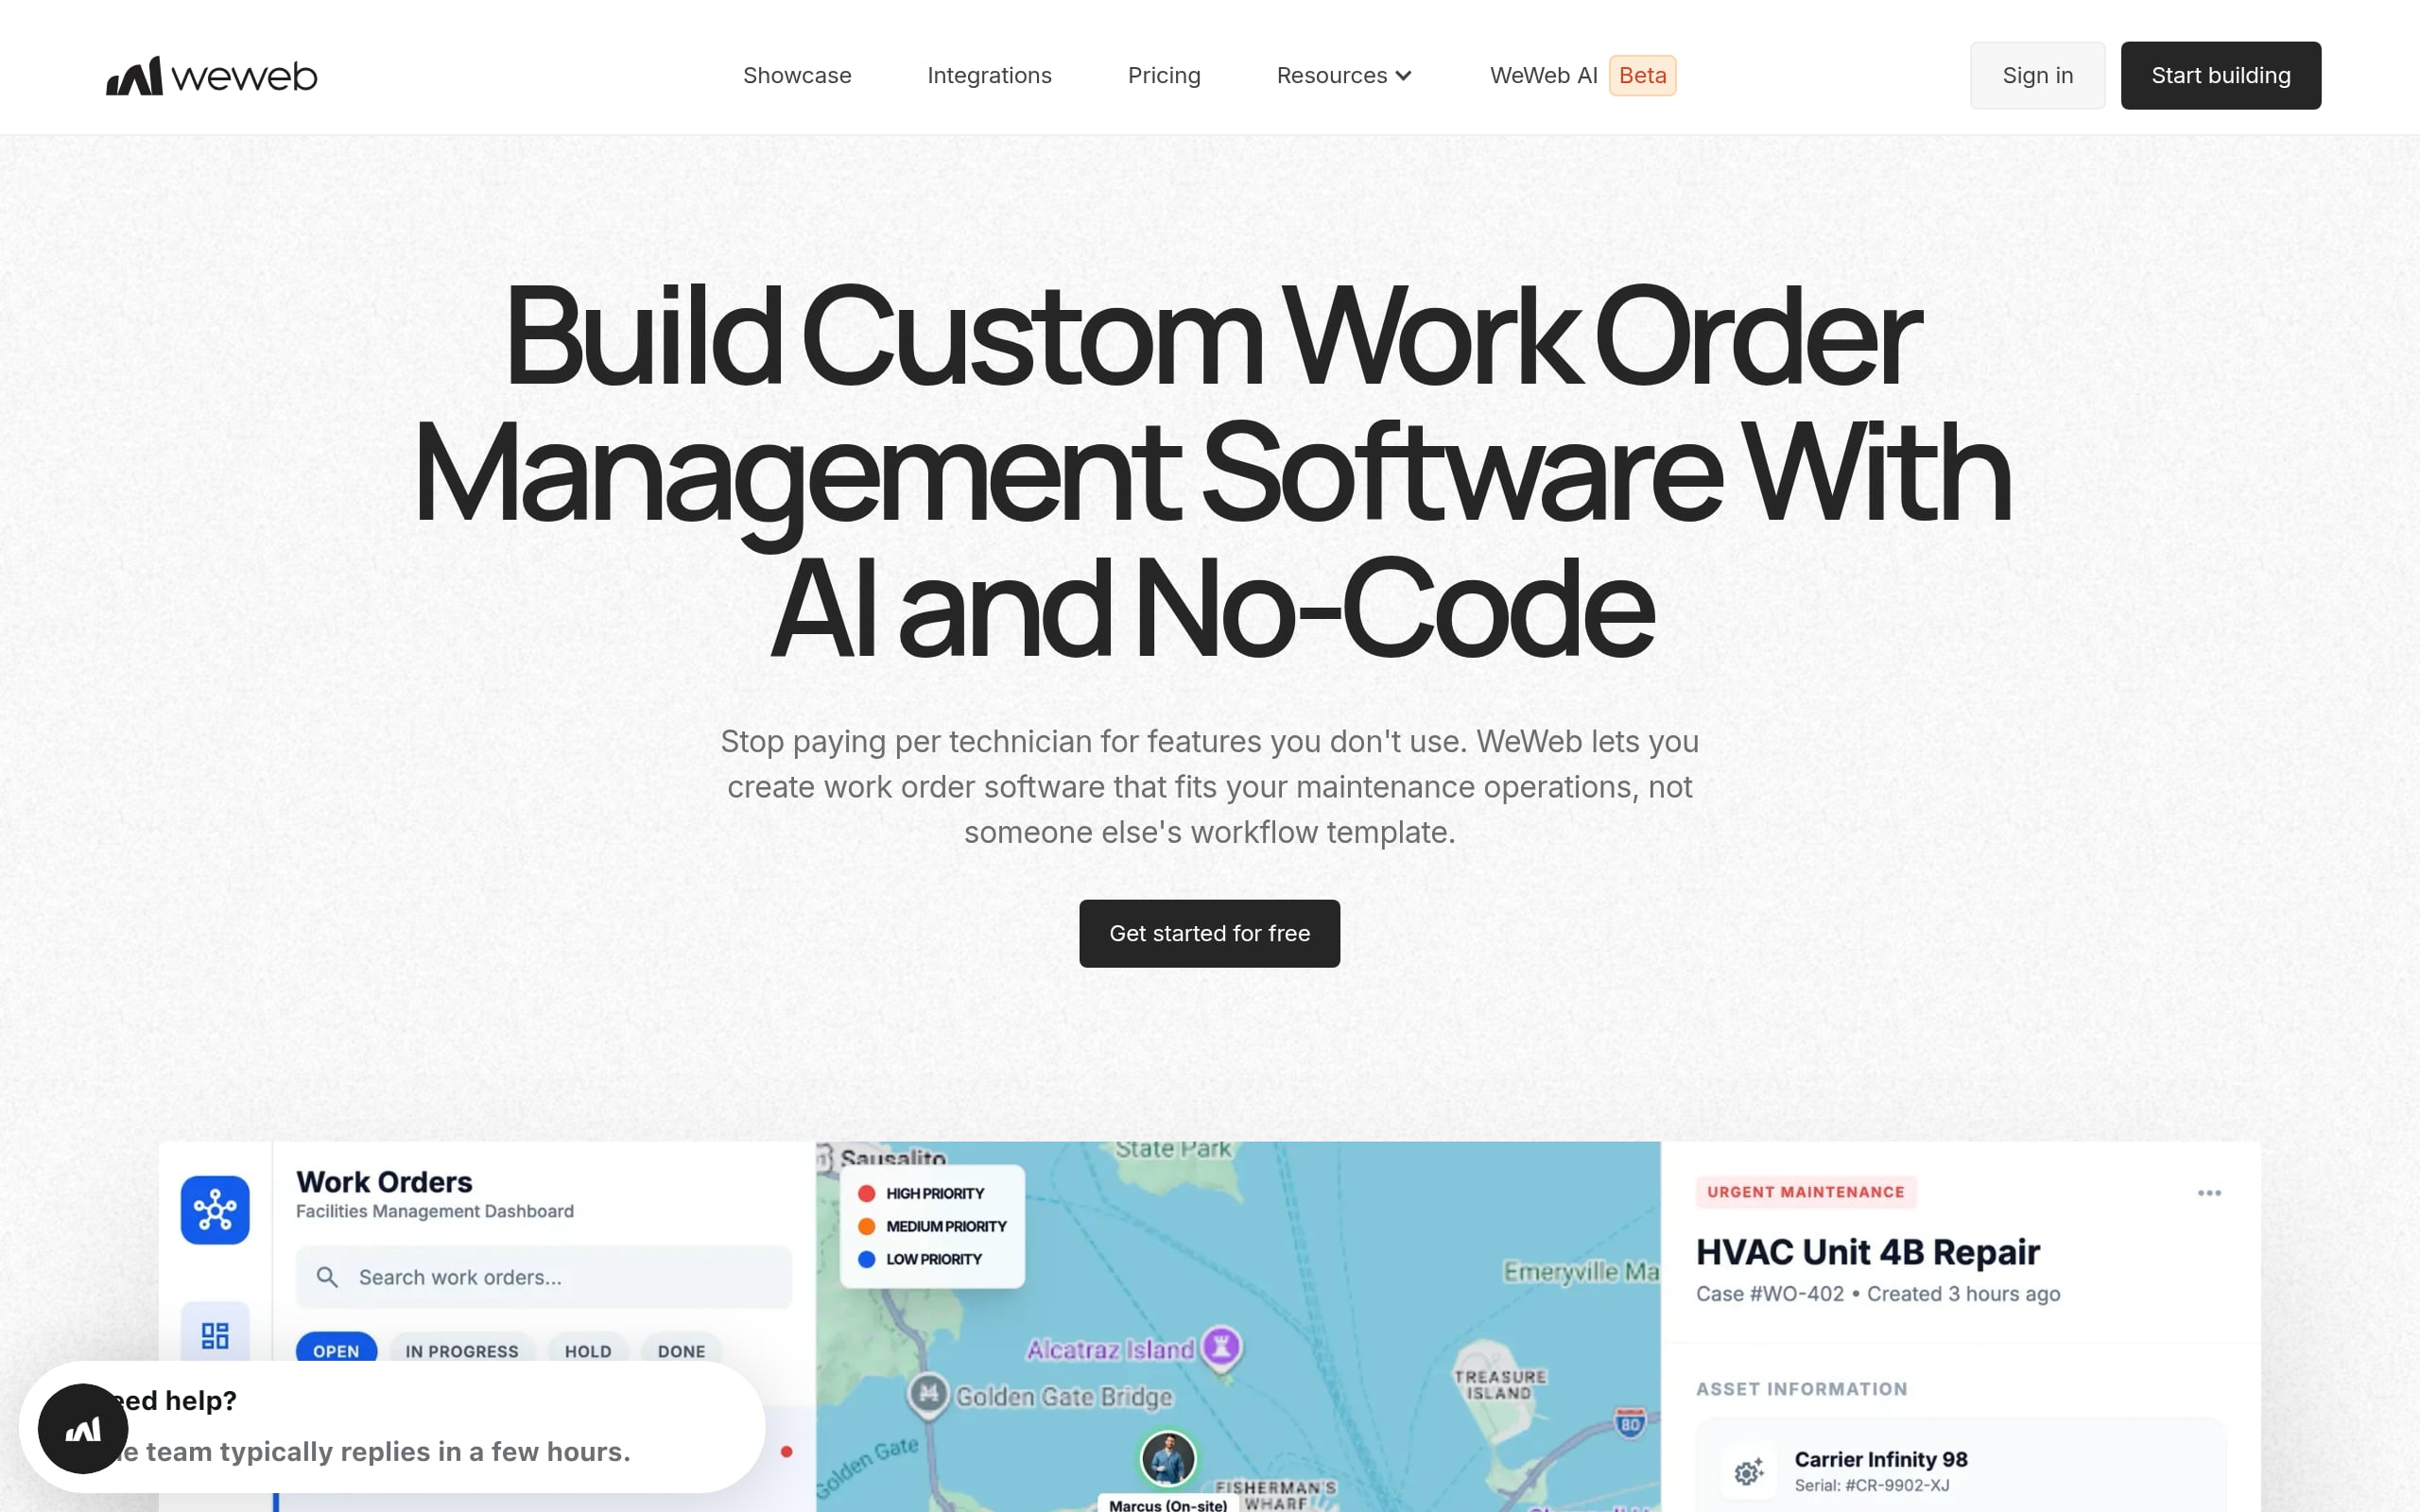
5. Maintenance & Work Order Dashboard
A true control tower for maintenance leaders and property managers, this dashboard consolidates work orders, preventive maintenance, and service requests across the portfolio. It clarifies workload, aging, technician capacity, and cost. This tames scattered ticketing, poor prioritization, and limited visibility into repeat issues or maintenance ROI.
Why it matters: Dispatch the right tech at the right time, prevent SLA breaches, and curb overtime. Expect higher first-time fix rates, fewer emergencies, and happier residents, which translates into lower risk and better NOI.
Signals to watch:
Data sources & WeWeb build notes: Source PMS (Yardi, AppFolio), CMMS (UpKeep), and accounting. In WeWeb, connect through a secure REST/GraphQL layer; enforce RBAC and row-level security in the backend (e.g., Supabase). Use custom Vue components for Kanban boards and schedulers; paginate and cache for snappy UX.
6. Lease Renewal & Retention Dashboard
For leasing, operations, and asset teams, this dashboard makes the renewal journey visible end to end, from eligibility and outreach SLAs to pricing offers, acceptance, and final retention. It eliminates renewal guesswork, prevents expiration cliffs, and stitches together fragmented pipeline views so no at-risk household slips through the cracks.
Why it matters: Price renewals with precision, trigger targeted save campaigns, and stabilize cash flow. Higher retention, lower vacancy loss, and smoother operations follow. This boosts NOI and portfolio value through predictable income and reduced turnover costs.
Signals to watch:
Data sources & WeWeb build notes: Pull from PMS (Yardi, RealPage), CRM (Knock, VTS), and pricing tools via a secure REST/GraphQL layer. In WeWeb, enforce RBAC and row-level security by role/property. Add custom Vue visuals for expiration curves and apply pagination to keep interactions fast.
7. Investment & NOI Performance Dashboard
Asset managers, finance, and leadership use this lens to connect operating performance to returns. It centralizes NOI and variance analysis, revenue and expense drivers, and debt service. This solves slow reconciliations and fragmented PMS/accounting data while tying property-level actions to fund-level outcomes and covenant compliance.
Why it matters: Allocate capital, decide hold/sell/refi, and re-forecast with conviction. Early visibility into expense creep or occupancy dips tightens cycles, improves NOI, and reduces lender risk through transparent, actionable signals.
Signals to watch:
Data sources & WeWeb build notes: Connect PMS (Yardi, MRI) and accounting via a secure API gateway (REST/GraphQL). In WeWeb, pass JWT claims to enforce row-level security by property/fund. Use custom Vue for waterfalls and heatmaps; pre-calc cohorts and rolling periods in the backend.
8. Multifamily Performance Dashboard
A unified control room for on-site, regional, and asset teams, this dashboard blends live leasing, ops, and financials. It tracks the lead-to-lease pipeline, unit availability, collections, and maintenance SLAs. This replaces brittle spreadsheets and inconsistent KPIs with a single, trusted narrative of multifamily health across communities and submarkets.
Why it matters: Pricing, marketing, and maintenance decisions sync to real-time demand and risk. Expect higher NOI, lower vacancy and delinquency, and faster resolution of critical issues without the reporting whiplash.
Signals to watch:
Data sources & WeWeb build notes: Pull PMS (Yardi, RealPage), CRM, and accounting via a secure REST/GraphQL layer. In WeWeb, enforce RBAC with row-level policies tied to roles/properties. Use custom Vue for complex visuals and paginate heavy tables; cache frequent queries for speed.
9. Leasing & Lead Conversion Dashboard
For leasing teams, managers, and marketing, this dashboard lays out the entire funnel, from source to signed lease, highlighting where prospects stall: first response, tours, applications, and approvals. It fixes slow follow-up, misattribution, high drop-off, and uneven agent performance by exposing the precise bottlenecks that steal conversions.
Why it matters: Reallocate spend to high-converting channels, coach agents on the right SLAs, and flex pricing to demand. Better lead-to-lease conversion and fewer days vacant feed directly into NOI and future occupancy stability.
Signals to watch:
Data sources & WeWeb build notes: Combine PMS/CRM (Yardi, RealPage), ad platforms, and call tracking via REST/GraphQL (Supabase/Xano). In WeWeb, use Supabase auth with row-level security for property-level access. Build custom Vue charts to visualize funnel leakage; add server-side filtering and caching for responsiveness.
Getting Started: Stand Up Dashboards That Stick
Implementing new tools can be challenging. To ensure your property dashboards are adopted and deliver value, follow a clear, strategic approach.
Conclusion: Turning Property Data Into Daily Decisions
In the modern real estate landscape, data is your most valuable asset. Property dashboards are the key to unlocking its potential, transforming raw numbers into clear, actionable insights that drive smarter decisions every day. By providing real time visibility, centralizing information, and enabling advanced analytics, these tools empower teams at every level to optimize performance, mitigate risks, and maximize portfolio value. The global PropTech market is projected to reach over $104 billion by 2034, demonstrating the immense investment in and reliance on these digital tools. Whether you choose a pre built solution or create your own custom application, embracing data driven decision making is no longer an option, it’s a necessity for success.
Ready to build a custom property dashboard that fits your exact needs? See how WeWeb gives you the power to create production grade applications without writing code, or book a demo.
FAQ
A property dashboard is a data visualization tool that centralizes and displays key performance indicators (KPIs) and metrics related to a real estate portfolio. It provides a real time overview of operations, financial health, and asset performance in an easy to understand format.
Common KPIs for property dashboards include Occupancy and Vacancy Rates, Net Operating Income (NOI), Rent Roll, Arrears, Maintenance Request Volume and Completion Time, Cost per Unit, and Tenant Turnover Rate. The specific KPIs should align with your business goals.
You can use specialized off the shelf property management software that includes dashboard features, general business intelligence tools like Tableau, or build a completely custom application using a visual development platform. Building a custom solution offers the most flexibility to tailor the dashboard to your specific workflows and data sources.
The main benefits include improved operational efficiency, faster and more informed decision making, enhanced visibility across a portfolio, proactive problem solving, and better financial performance. They help turn complex data into actionable insights for everyone from property managers to investors.
Yes, advanced property dashboards can use historical data and machine learning algorithms to perform predictive analytics. This can help forecast future vacancy rates, predict equipment failures, and identify potential market shifts, allowing for more strategic planning.
