



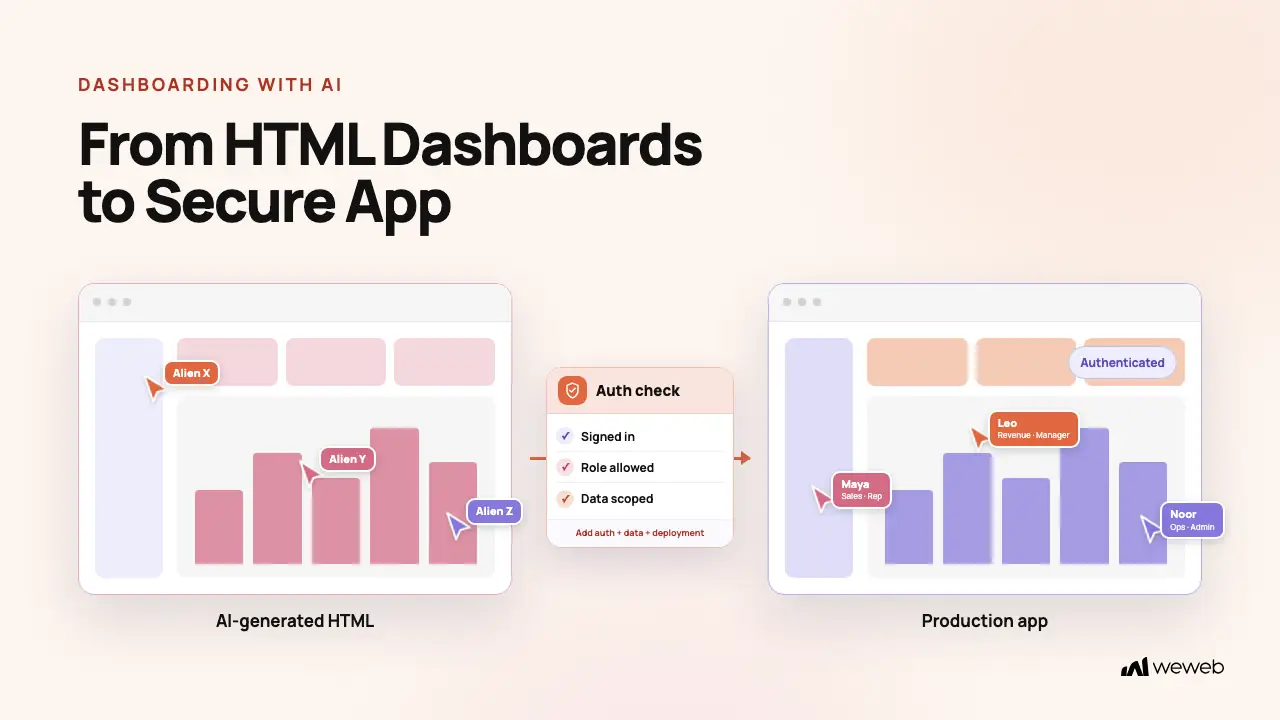
AI has made building dashboards incredibly fast. Describe the data question you want to answer, and a tool like Claude or ChatGPT can generate a working analytics dashboard in minutes. That part works well.
The problem comes next. The dashboard often lives locally on your laptop as an HTML file. To make it part of your daily operations, you need to put it online where your team can access it. If you publish the file as-is, anyone with the URL may be able to see the same data, including confidential sales figures, customer metrics, and financials. There is no sign-in flow, role-based filtering, or backend authorization unless you build those layers yourself.
This guide shows you how to use WeWeb to turn a dashboard built with AI into a secure application your team, customers, or clients can use.
Why AI-Generated Dashboards Aren't Production-Ready on Their Own
AI tools like Claude, and ChatGPT are genuinely good at dashboard layout. Describe your metrics, your filters, your preferred chart types, and you get a working result fast. Iterating on the design through prompting is quick.
But what you get is an HTML file. And getting that file in front of your team, safely, requires solving three problems AI code generators don't make easy:
- Authentication: Who is allowed to access this dashboard? If you host an HTML file, anyone with the URL can open it.
- Role-based data filtering: Different users should see different data. A sales rep should see their own pipeline. A manager should see their team's. An executive should see everything. A static file doesn't know who is logged in.
- Deployment: Hosting a file is not the same as deploying an application. File hosting gives you a URL. Application deployment gives you auth, user management, role enforcement, and ongoing access control.
These aren't edge cases. For dashboards that handle sensitive business data and different user roles, these are core requirements. Building the layout is only the start.
7 steps to turn a dashboard built with AI into a production-ready app
These seven steps take a dashboard from an initial idea, dataset, or generated artifact to a working application with maintained data, custom interactions, authentication, backend-enforced access, automation, and deployment.
Step 1: Generate your dashboard layout
Choose the route that matches the material you already have.
- You only have an idea: Prompt WeWeb AI in the visual editor. Describe the dashboard's users, metrics, charts, filters, and actions. Attach files or project context when useful.
- You have a spreadsheet or CSV: Import it into WeWeb Tables. Add the relevant table views to the AI context so the generated charts and filters use the fields that are actually available.
- You have an API or database: Connect it through WeWeb's Data & API layer. Provide the collections, schema, or views that the dashboard should use. The source can remain external and does not need to be copied into WeWeb Tables.
- You already have an AI-generated HTML dashboard: Connect the originating AI client through WeWeb MCP. Share the HTML artifact, source files, screenshots, and original prompt, then ask the agent to recreate the interface in your WeWeb project. Treat the artifact as a design and behavior reference, not as a production application that can be imported automatically.
Whichever route you start from, review the generated layout before moving on. Make sure it includes the right metrics, charts, filters, and data fields for your dashboard.
Step 2: Review the generated output visually
The generated dashboard appears in our visual editor. Click through each section:
- Is the layout what you expected?
- Are the charts showing the right data?
- Are the filters in the right position?
- Are loading, empty, and error states clear?
Walk through the generated result first. Identify what needs adjustment before you start editing.
Step 3: Edit layout and components directly
Use the visual editor to make targeted adjustments. It gives you a more controlled outcome for the specific change you want to make, without the risk of an AI re-generation touching other parts of the dashboard.
To change a chart type: Click the chart component, open the settings panel, select the new chart type. Done.
To move a section: Drag it. Sections snap to the grid.
To add a new metric: Drag a chart component from the component library onto the canvas. Connect it to your data source by clicking the data binding selector.
To change column order in a table: Click the table component, open the columns panel, drag columns into the order you want.
For major structural changes like adding a new section, generating a new data model, or rebuilding application logic, use AI. For precise, targeted edits where you know exactly what you want, the visual editor gives you control over exactly what changes.
Step 4: Configure authentication and role-based access
Authentication verifies who the user is. Authorization determines which resources and actions that user can access. A dashboard needs both.
Role-based dashboard experiences work at two levels:
Backend data authorization controls the records each role can retrieve. When a sales rep logs in, the backend should return only their deals. When a manager logs in, it should return deals for their team. An administrator may be authorized to query the full dataset.
Set this up by:
- Defining users and roles in WeWeb Auth or your external authentication provider
- Enforcing tenant, team, or row-level access in the backend
- Connecting the dashboard to endpoints or queries that respect those rules
- Testing with a user from every role and tenant
Section visibility by role: Some sections should only appear for certain roles. The admin KPI summary, for example, should be visible only to admins.
In the editor, click the section, open the visibility settings, and set the appropriate condition. Visibility rules shape the interface, but they do not protect data by themselves. A hidden section can still expose information if the underlying request returns records the user should not receive.
Step 5: Connect your data sources
A single dashboard can combine multiple data sources when a workflow spans different systems.
You can add or change connections through the visual editor.
Supported connections:
- WeWeb Tables, the built-in Postgres backend, for storing dashboard data
- Supabase, Xano, or any REST/GraphQL API for external data
- Airtable or Google Sheets for teams already managing data there
Step 6: Automate reports and alerts
Teams can quickly end up with dozens of dashboards and reports, each waiting for someone to remember to check it. That is still a reactive experience. Make the dashboard more useful by sending the right update to the right person when something changes or when a regular review is due.
Use backend workflows with WeWeb's Send Email action to automate reports and alerts. For example:
- Alert a sales manager when a deal moves into a high-risk stage
- Notify an account owner when usage crosses a threshold
- Email a customer after new reporting data has been processed
- Send management a weekly summary with the latest KPIs and a link to the full dashboard
Step 7: Deploy
Deploy to WeWeb's hosting infrastructure to make the dashboard available at a live URL. Authentication and backend authorization still determine who can access the application and its data.
If your organization needs to self-host the interface, export the built interface files and deploy them to your own infrastructure. The backend must remain hosted and reachable. Full-stack self-hosting is not currently available for applications that depend on WeWeb-managed backend capabilities.
Before launch, test:
- Sign-in, sign-out, recovery, and session expiry
- Every role and tenant boundary
- Direct requests to protected endpoints
- Loading, empty, error, and disconnected states
- Responsive layouts and keyboard navigation
- Monitoring, logging, and the team's update process
Role-based dashboards for different users
A role-aware dashboard can support several audiences without duplicating the entire application:
- SaaS products with customer dashboards: each customer sees only their own data
- Internal analytics tools: execs, managers, and reps need different views
- Client portals: each client sees their project data
Define backend authorization before polishing conditional visibility. This keeps data enforcement and interface presentation aligned as the dashboard evolves.
Top dashboard-building paths compared
The right option depends on what you want your dashboard to become. Here’s how the main approaches compare.
WeWeb
Best for: Custom dashboard applications that need visual editing, authentication, and room to grow.
Build the dashboard with WeWeb AI or use an external agent through WeWeb MCP. You can store data in WeWeb Tables or connect external sources such as Supabase, Xano, REST APIs, and GraphQL.
For access control, use WeWeb Auth or an external authentication provider and enforce permissions through protected native views and endpoints or your connected backend.
Deployment: Publish with WeWeb hosting or export the interface and host it elsewhere while keeping the backend hosted and reachable.
Portability: Built or raw interface files can be exported, although ongoing development outside WeWeb is not the intended workflow.
Pricing: See WeWeb pricing for builder seat and hosting options.
Lovable
Best for: Generating a full-stack web application primarily through prompts.
Lovable uses AI to generate and revise both the frontend and backend. You can use Lovable Cloud or connect your own Supabase project for backend functionality.
Authentication and permissions can also be handled through Lovable Cloud or Supabase. Permissions and row-level access should be enforced on the server and in the database.
Deployment: Publish through Lovable or deploy the generated code through an external host.
Portability: On paid plans, you can download the codebase or sync it with GitHub or GitLab.
Pricing: See Lovable pricing for workspace plans. Backend or hosting usage may add additional costs.
Metabase
Best for: Governed BI and analytics dashboards built on existing databases and data warehouses.
Metabase connects to existing data infrastructure and provides Metabot for AI-assisted chart creation, SQL generation, and data analysis.
For access control, Metabase supports groups and data permissions. Row and column security is available on Pro and Enterprise plans.
Deployment: Use Metabase Cloud or self-host Metabase.
Portability: The open-source edition can be self-hosted. Pro and Enterprise serialization can move dashboard configuration as YAML rather than exporting a standalone application codebase.
Pricing: See Metabase pricing for open-source and paid options.
Claude Artifacts / Claude Code
Best for: Quickly creating interactive prototypes, artifacts, and shareable single-page experiences.
Claude can generate an interactive artifact directly. Claude Code can also publish session output as an artifact.
Depending on the Claude product and plan, artifacts can work with files, storage, connected apps, or approved MCP connectors. Claude Code artifacts, however, do not provide an application backend of their own.
Artifacts also do not provide app-defined viewer authentication or custom roles.
Deployment: Anthropic hosts the artifact page. A full application with its own backend or multiple routes requires separate infrastructure.
Portability: Chat artifacts can be copied or downloaded, while Claude Code writes the HTML or Markdown source into the project.
Pricing: Chat artifacts are available across Claude plans; Claude Code artifacts require an eligible paid plan.
Google Sheets canvas
Best for: Interactive dashboards where the spreadsheet itself is the data source.
Gemini can generate and revise the canvas layout, design, and functionality without requiring you to write code or formulas. A single Sheets tab acts as the data layer, with changes synchronized between the canvas and source sheet.
Access follows the spreadsheet's existing permissions. Editors can modify data, while commenters and viewers cannot. It does not provide app-defined roles or record-level access policies.
Deployment: The canvas lives inside Google Sheets and can be shared according to the spreadsheet's access settings.
Portability: It remains part of the spreadsheet and works with files stored in Google Drive rather than offline files or third-party storage.
Availability: Google Sheets canvas is included with eligible Google Workspace and Google AI plans, with per-user limits on creating and editing canvases.
Which path should you choose?
Choose Google Sheets canvas when your spreadsheet is already the data source and spreadsheet-level sharing is enough.
Choose Metabase when you need governed analytics over existing databases or data warehouses.
Choose Claude Artifacts when you want to create and share an interactive result or prototype quickly.
Choose Lovable when you want AI to generate a code-based, full-stack web application.
Choose WeWeb when you need a dashboard that stays visually editable while growing into a maintained application with custom logic, authentication, backend authorization, and deployment.
Frequently asked questions
What can I use to build a dashboard with AI?
You can ask an AI assistant or coding agent to generate a dashboard as an HTML file, interactive artifact, or code project. You can also use WeWeb AI inside the visual editor or connect an external AI client to WeWeb through MCP when the dashboard needs to become a maintained application.
Can ChatGPT create a dashboard?
ChatGPT can help define metrics, propose a layout, write code, or prepare a specification for an app builder. Turning that output into a production dashboard still requires data connections, authentication, backend authorization, deployment, and testing.
How do you turn a dashboard built with AI into an application?
Start with the generated interface, original prompt, screenshots, or artifact. Rebuild it in the application environment, review the result visually, connect maintained data, configure authentication and backend authorization, then deploy and test the complete application.
Can I connect my dashboard to real-time data?
Yes, when the selected backend and connection support real-time updates. Supabase and Xano can support real-time data patterns, but the exact behavior depends on how you configure the source and application.
Can I embed my dashboard in another app or website?
WeWeb apps can be embedded as iframes or accessed via direct URL. Embedding does not replace authentication or backend authorization, so test the complete sign-in, session, and data-access flow in the embedded context.
What if I need a chart type that isn't in the default components?
Our component library includes common chart types such as line, bar, pie, donut, scatter, table, and KPI cards. For custom visualizations, you can add a coded component or use a third-party chart library.
Can I export dashboard data?
Data export is handled through your backend. If your data is in WeWeb Tables, configure the export through that system. If you're using Supabase or another backend, exports work through that system.
Conclusion
AI tools are fast at building dashboard layouts and interactive artifacts. The gap is everything after: maintained data, authentication, backend-enforced data access, deployment, and testing.
WeWeb combines AI generation with a visual editor, flexible backend options, and a choice between WeWeb hosting or exporting the interface to your own infrastructure. Use AI for the initial build, then make targeted changes in the visual editor.
If you need to turn a dashboard built with AI into a maintained application, explore WeWeb's AI app builder.