


You don't need to be a tech guru to master building a no-code dashboard. In this easy-to-follow guide, we'll take you through the process of creating a dynamic, no-code dashboard without writing a single line of code.
With WeWeb, not only do we simplify the process, but we also equip you with a wealth of resources. From step-by-step video tutorials to weekly office hours for personalized support — we've got you covered.
With our guidance, you’ll be building dashboards in no time. 🔥
Understanding the Basics of Building Dashboards
Why are dashboards so important? One word — data.
Whether you're tracking website traffic, analyzing revenue trends, conducting market research or need quick access to other metrics, dashboards are your go-to solution. They offer a clear visual representation of key data points. This helps you make quick decisions at a glance.
With a range of features like charts, graphs, widgets, and customizable elements, they transform complex data into a clean, concise format. And the best part? You can personalize them with contrasting colors and designs that are not only visually appealing but also incredibly user-friendly.
By harnessing the power of no-code dashboards, you're not just organizing data — you're enhancing your ability to interpret and act on information effectively.
Preparing to Build Your Dashboard
Before we explain how to build a dashboard, you’ll need to lay some groundwork. Consider these three steps before you build your no-code dashboard.
- Identifying Your Data Sources: Begin by pinpointing the Key Performance Indicators (KPIs) and data that will bring your dashboard to life. This could range from net profit and customer engagement metrics to social media traffic and click-through rates. Understanding which KPIs to track is the first step towards deciding how to visually represent them in your dashboard. WeWeb easily integrates with a number of popular data sources, making connecting to your data quick and easy.
- Layout Design: Prioritize the user experience in your layout design. The goal is to present data in a manner that's not just visually appealing but also easy to understand. Consider various presentation styles — like pie charts for market share visualization, scatter plots for identifying data correlations, or line charts for tracking progress over time. Following dashboard design principles are a great way to design a user friendly layout.The right design choice can turn complex data into insightful, easy-to-digest visualizations.
- Establishing Clear Objectives: Define what success means for your dashboard. Are you aiming to monitor progress toward a specific goal or assist your team in strategic decision-making? For instance, if tracking revenue is your aim, incorporating a straightforward line chart could effectively visualize this data. Customizing your dashboard to align with these objectives is key, ensuring that each component contributes meaningfully to your overarching business goals.
How to Build a No-Code Dashboard on WeWeb: Step-by-Step
When you build a dashboard with WeWeb, you get the benefits of code (flexibility) and no-code (speed). Follow the steps outlined below.
Create your WeWeb Account
Your first step is to create an account on WeWeb. To get started, go to weweb.io, where you can either sign in or explore our platform with a free trial. Once you've set up your account and logged in, you'll land in your very own workspace.
Select the Dashboard Template
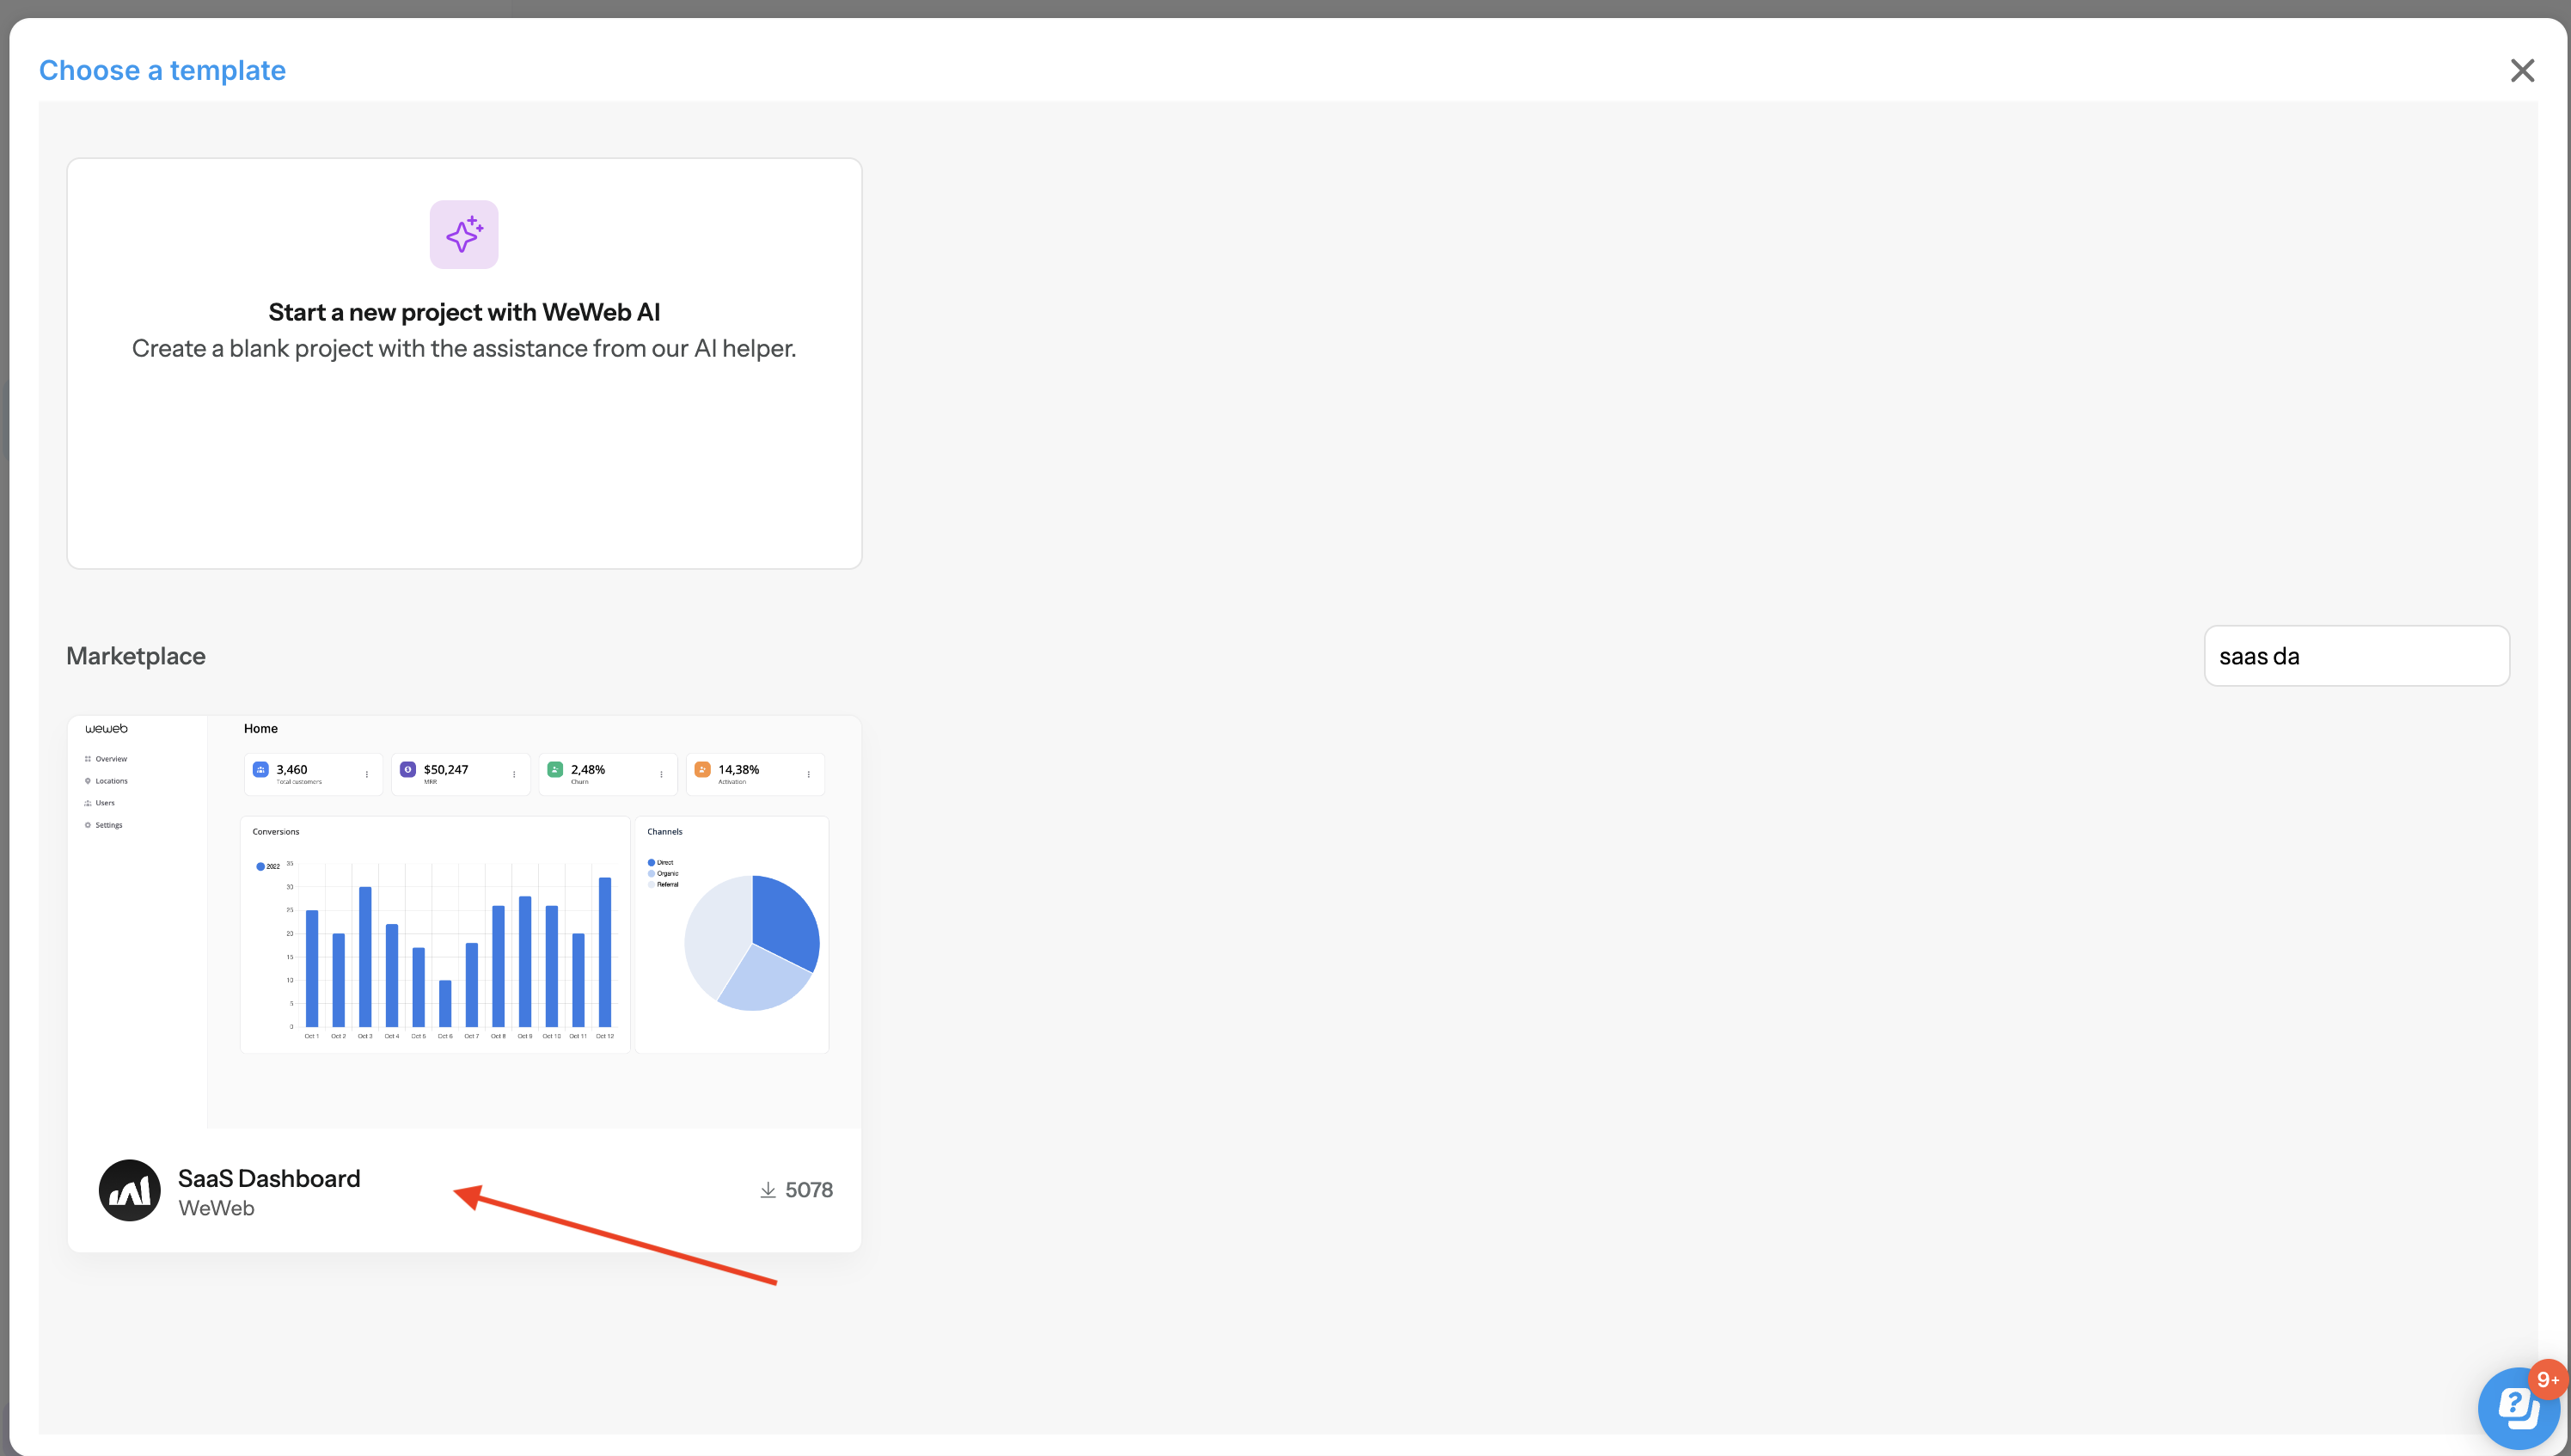
To start creating your no-code dashboard, click on ‘+ Create.’
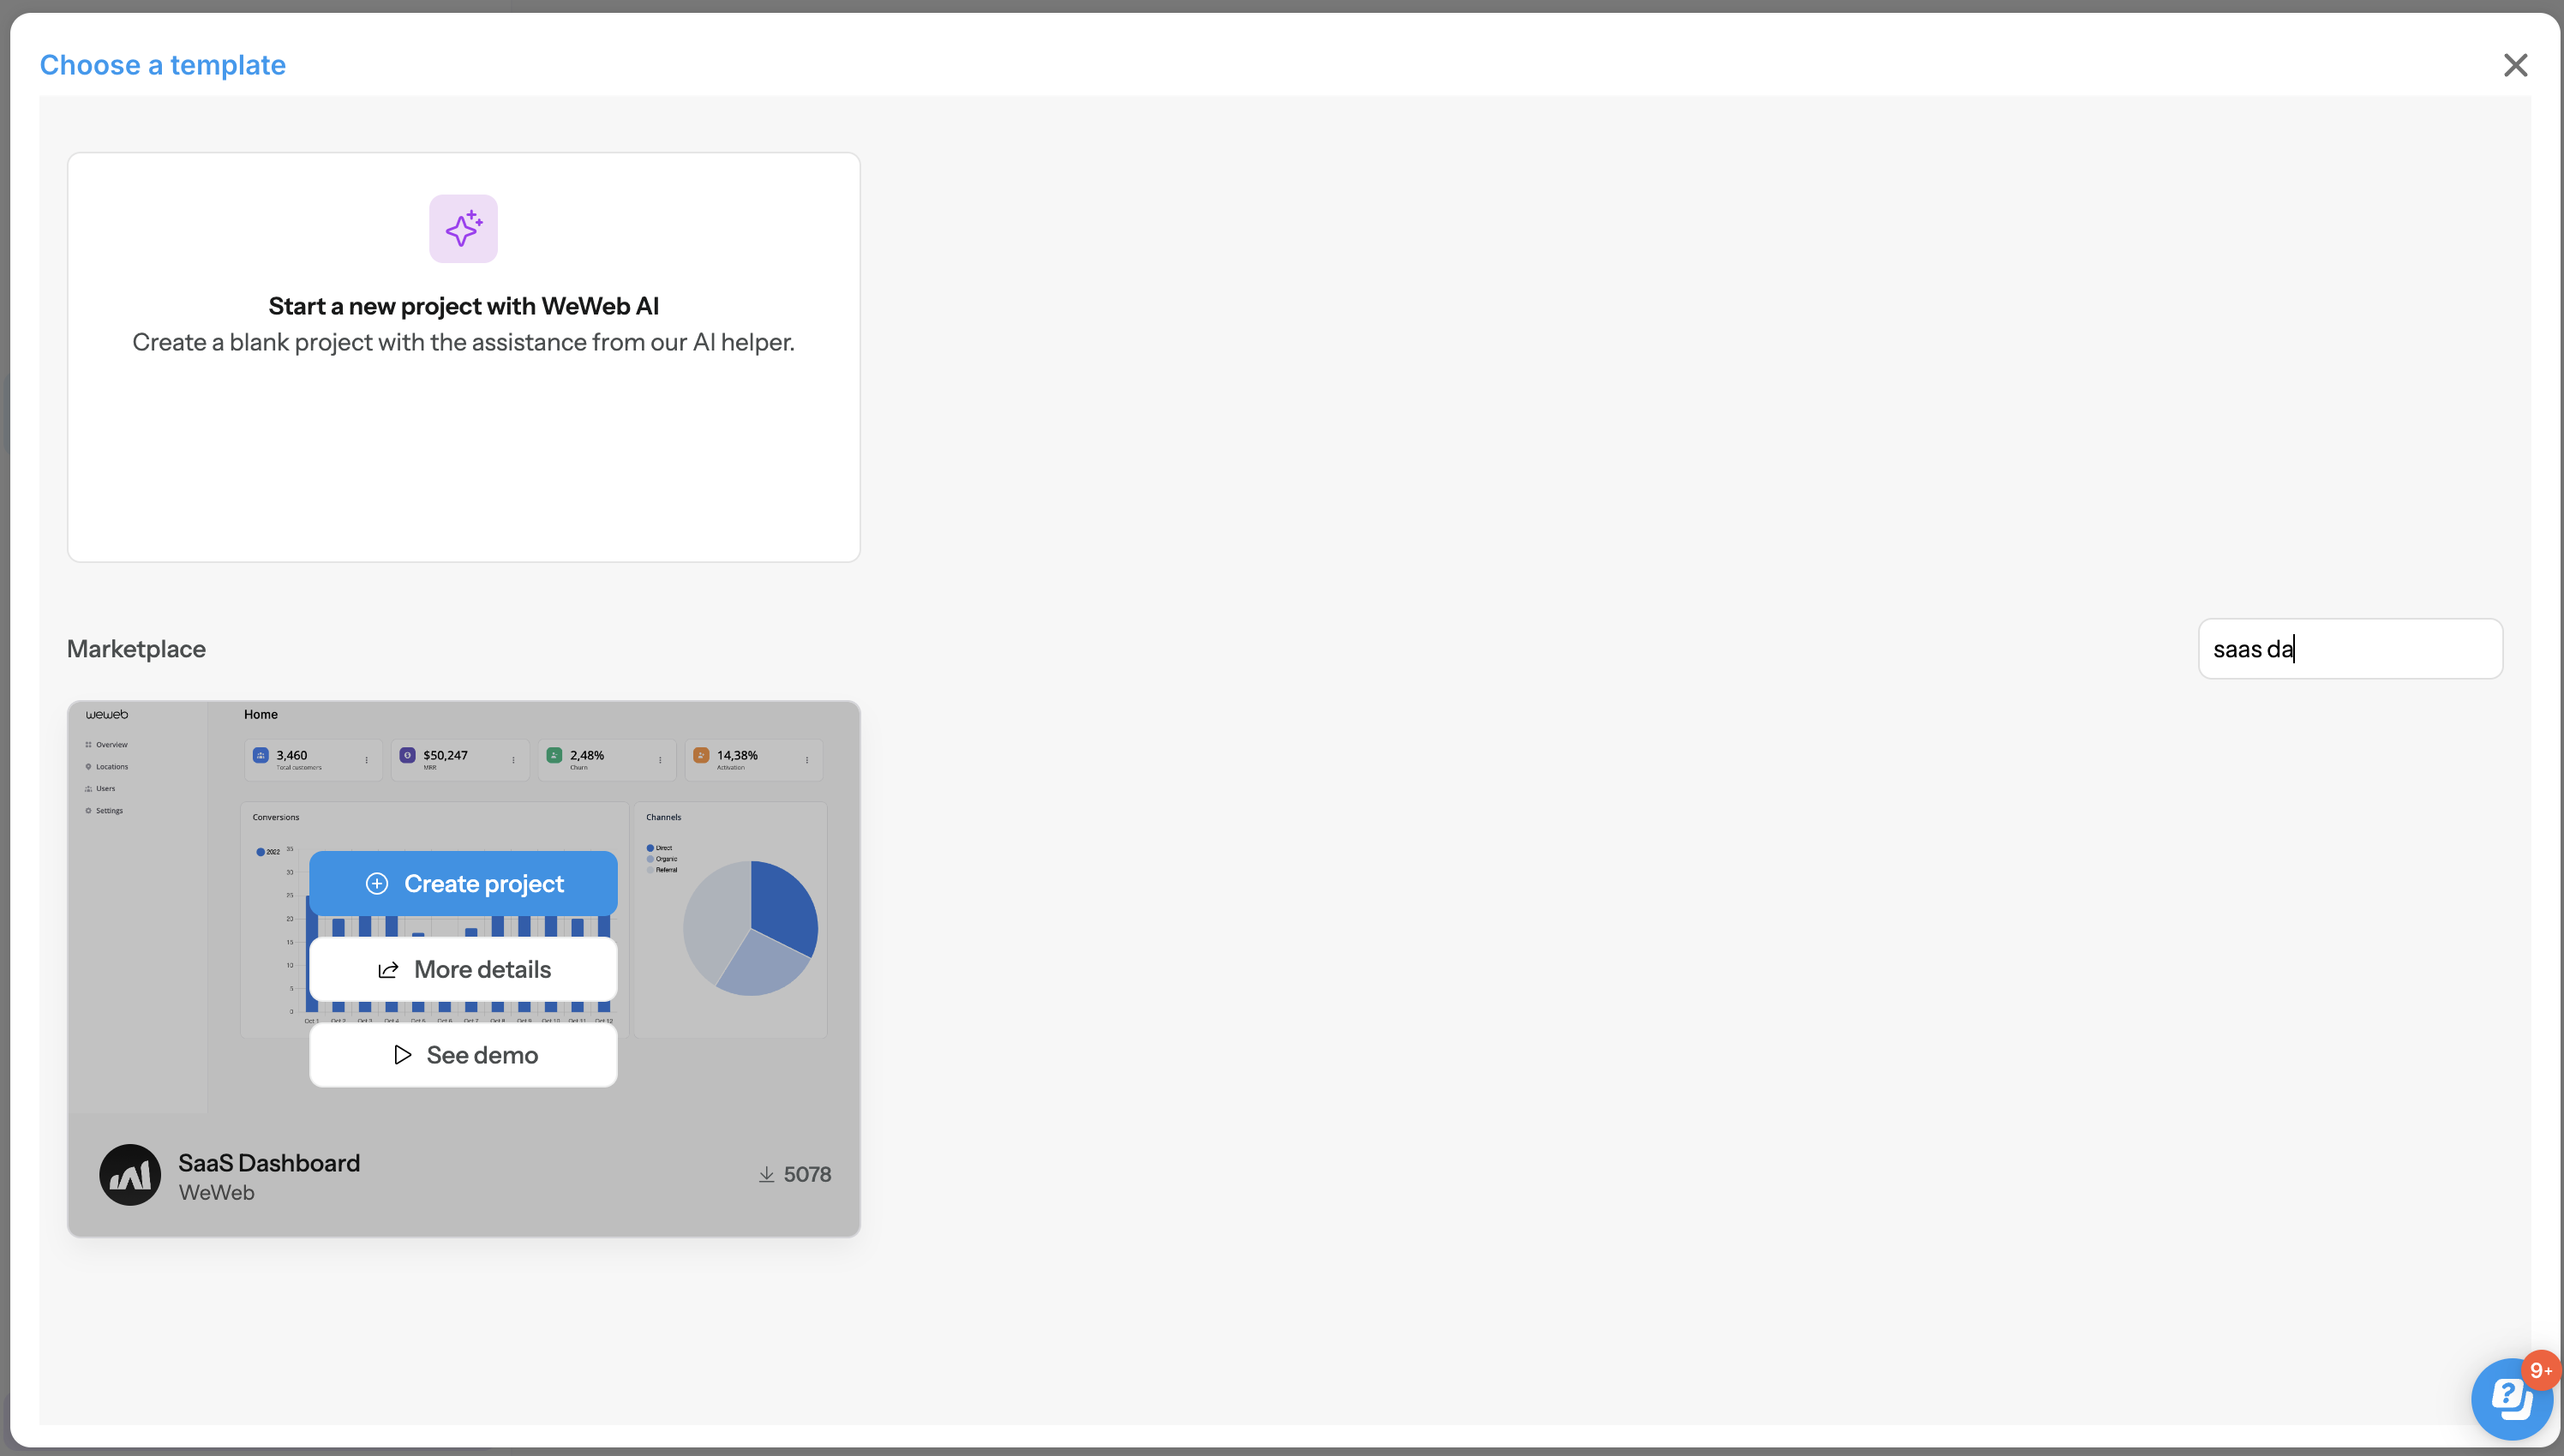
On the next screen, you’ll find the Dashboard template and click ‘Select ➡️.’ Feel free to preview this layout or explore the other templates available.
Next, personalize your project by naming it and setting your default language.
Once you step into the Editor, you'll be greeted by a screen that's your new playground for innovation and design:
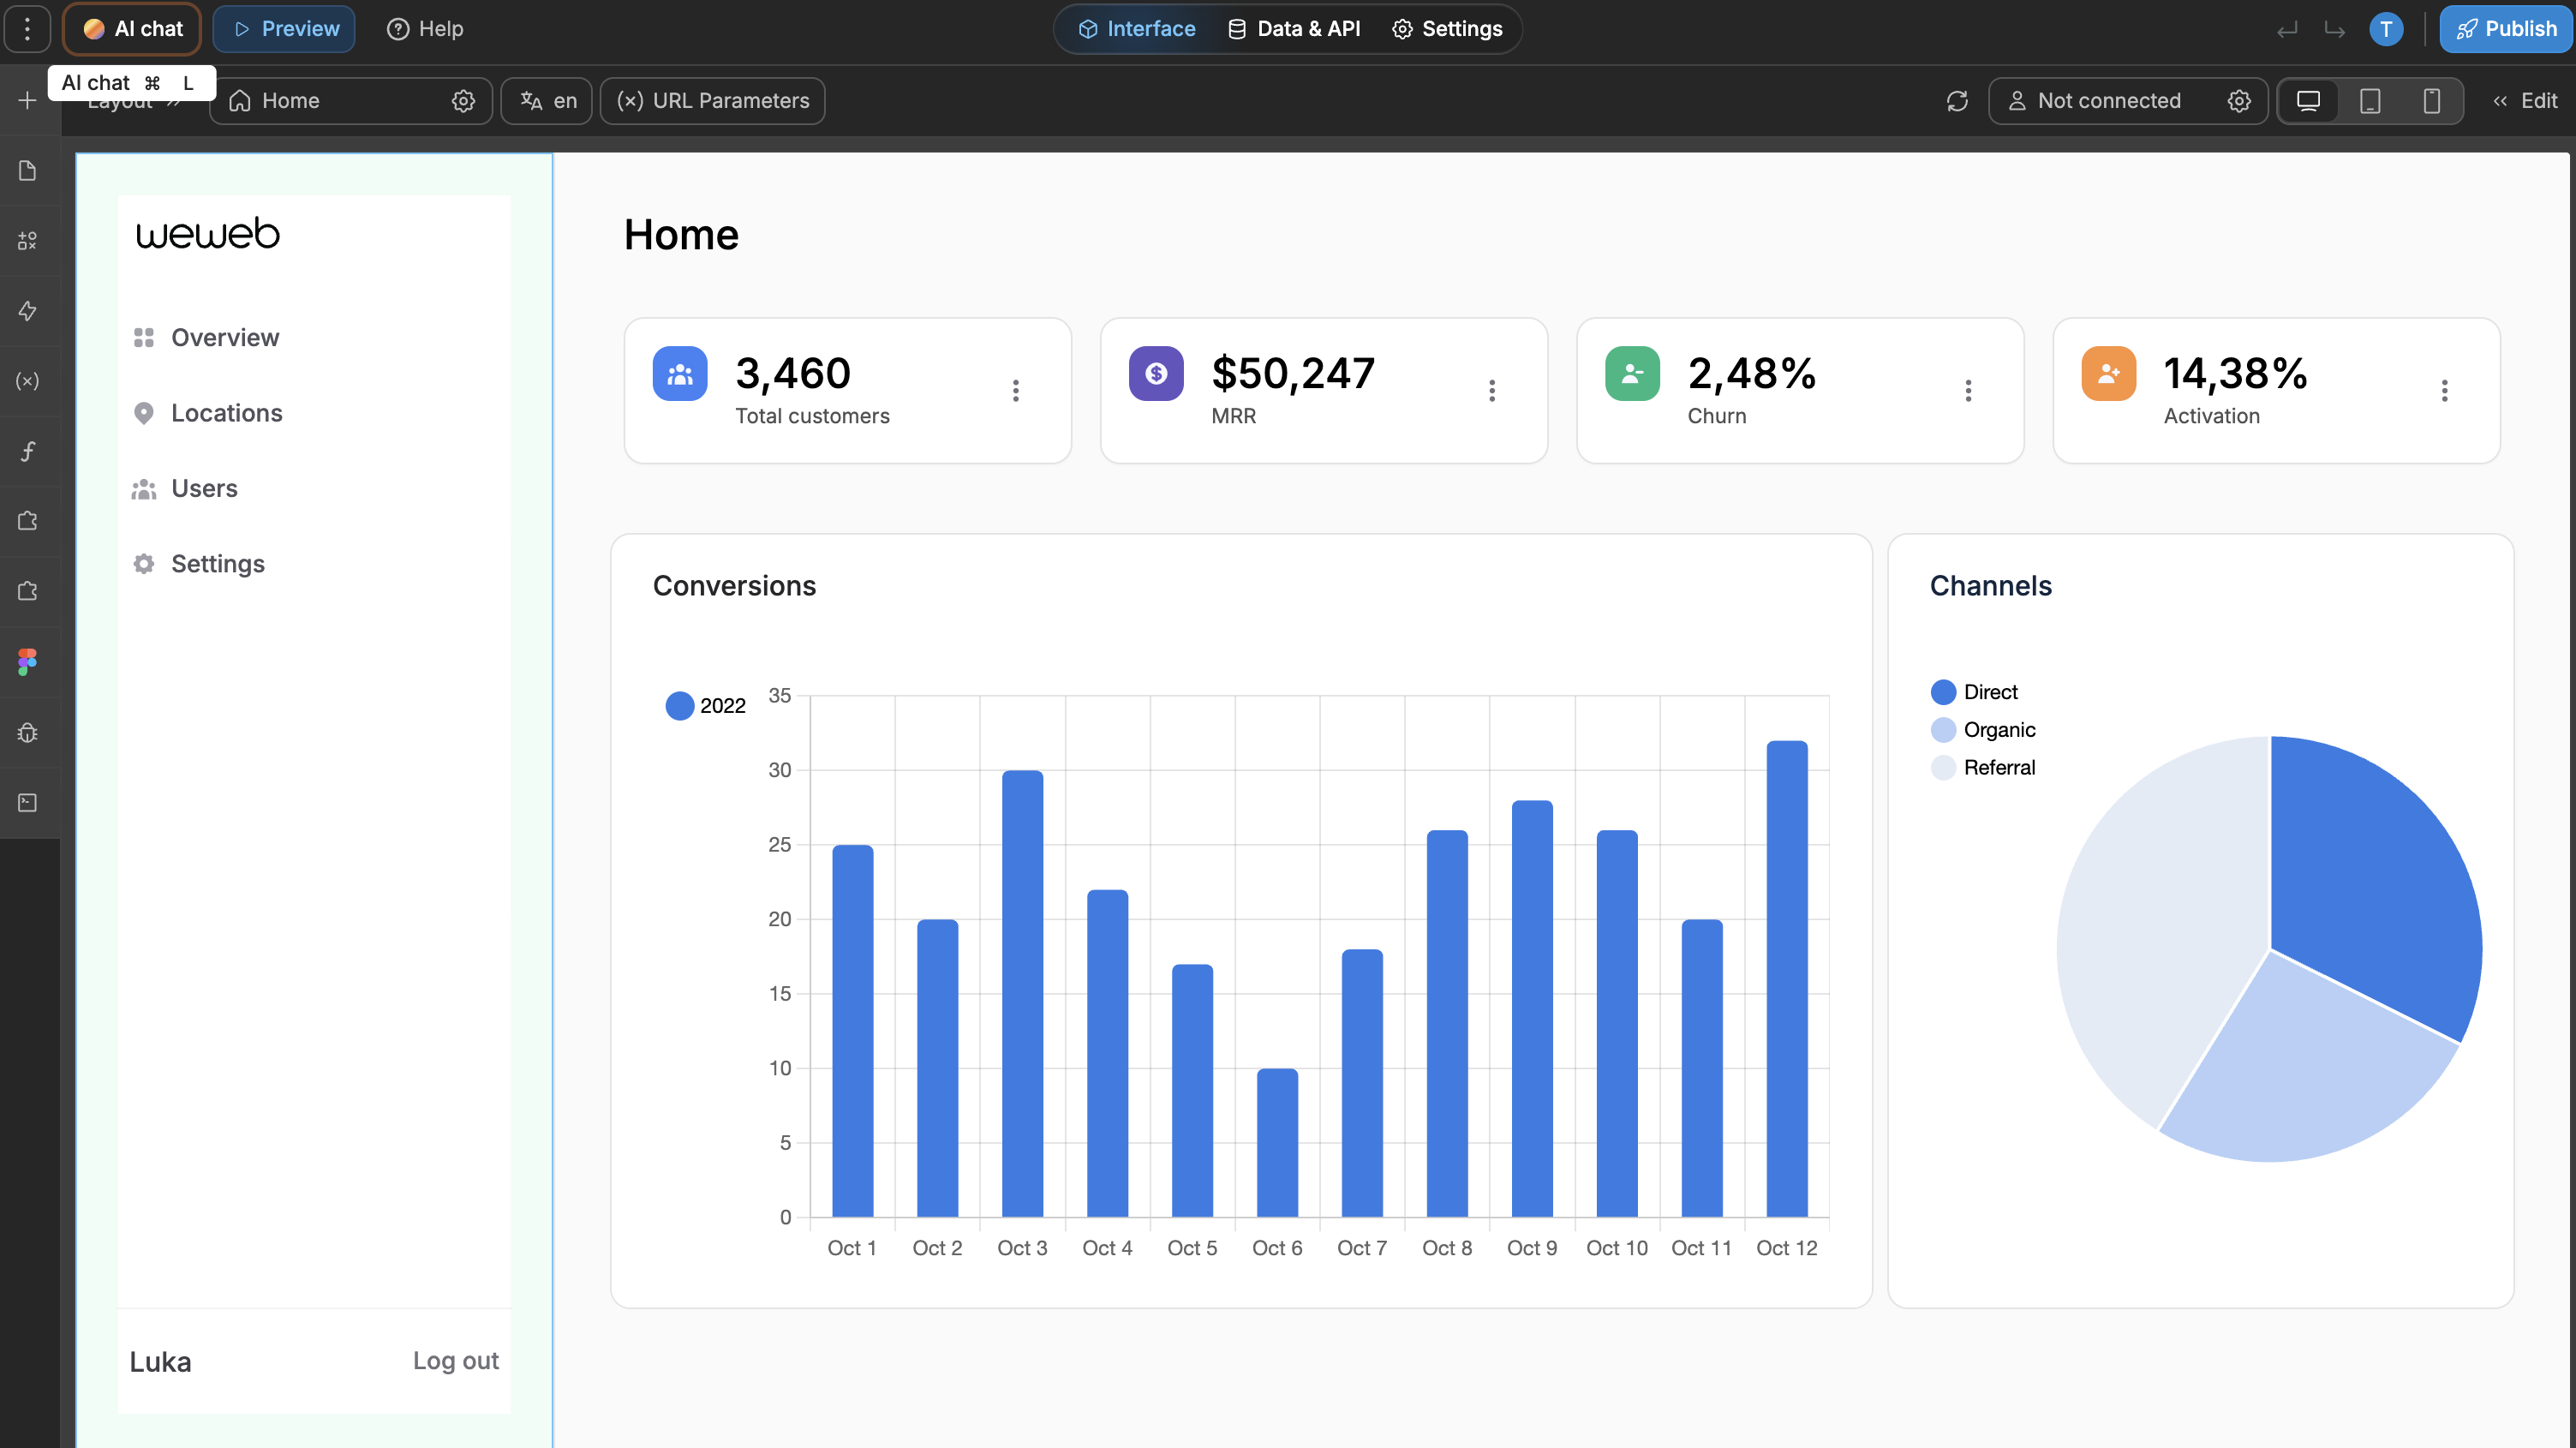
This is where your data starts taking on a visual form, transforming into a dashboard that’s both functional and aesthetically pleasing. From this point, the real magic begins. Your dashboard is a canvas that you can customize completely.
Customize the Dashboard’s Appearance
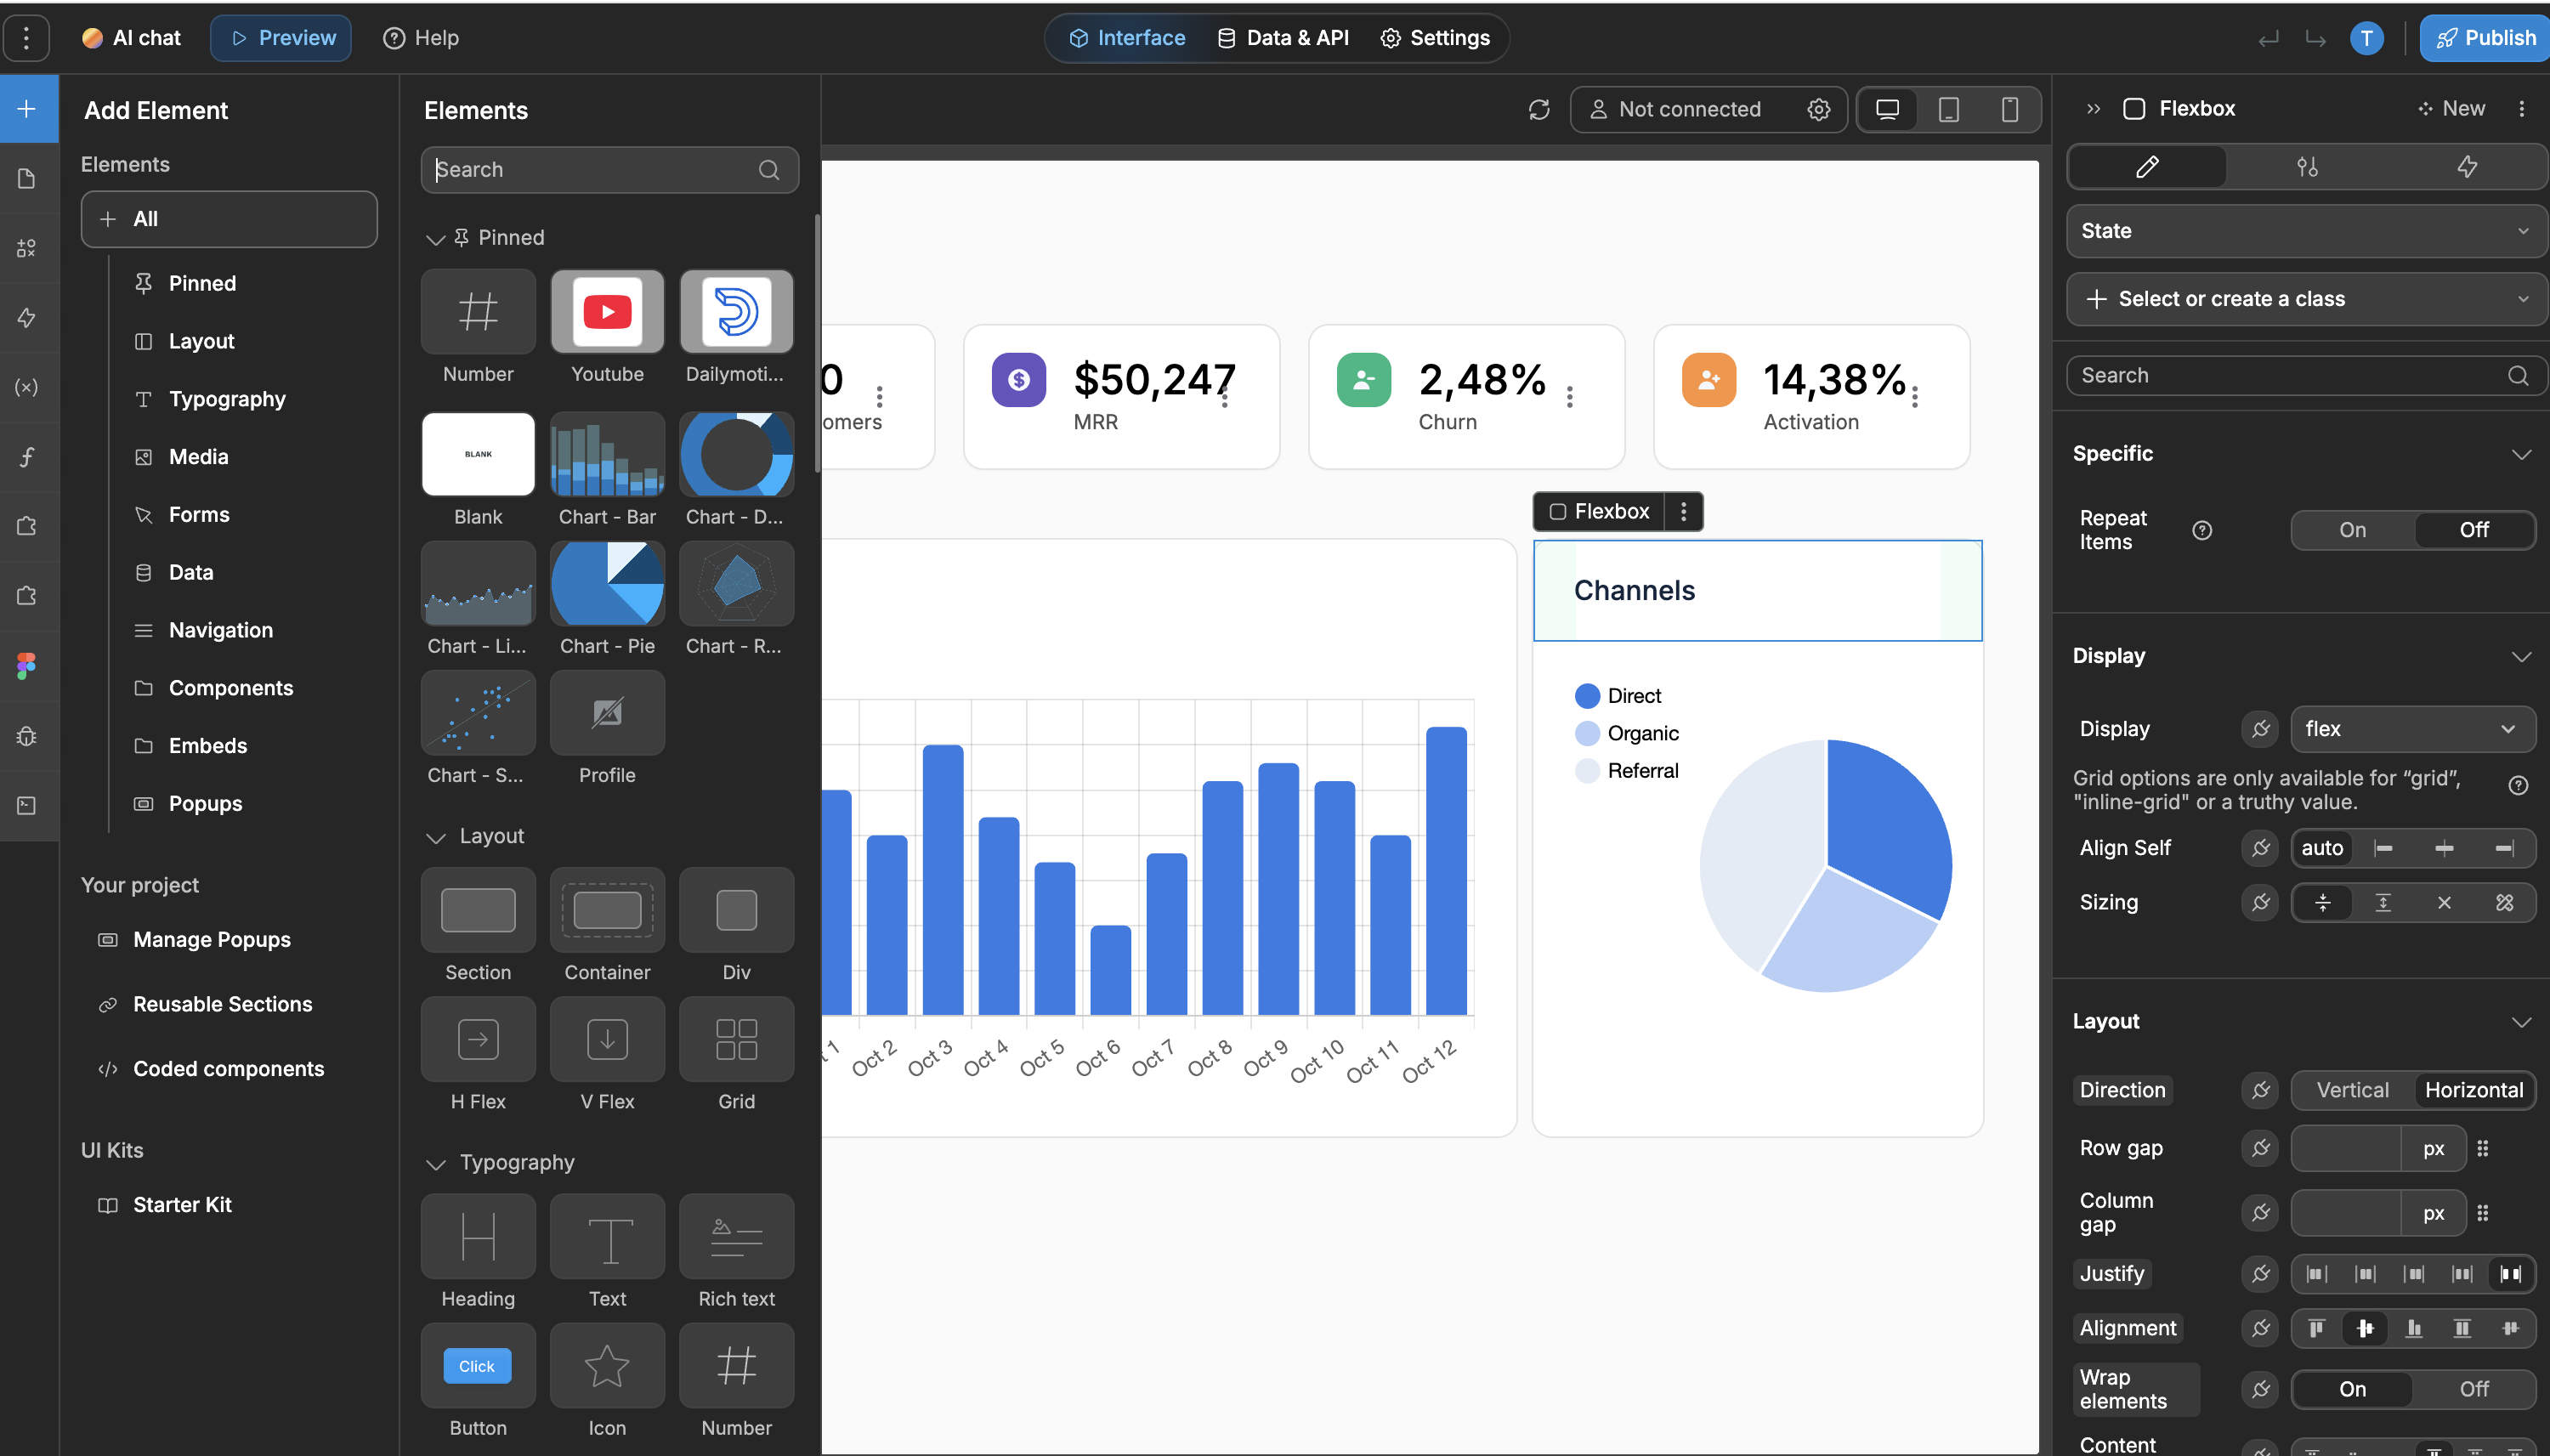
With our no-code dashboard builder, you have the power to:
- Construct a welcoming landing page
- Add custom typographies, colors, images, icons, and fonts
- Edit the header, side menu, and content to reflect your company’s style guidelines
- Implement features like charts, navigational bars, search, and date range filters
- Incorporate authentication steps to ensure security and user-specific access
- Enrich the user experience with personalized views
Moreover, you have the flexibility to showcase your data in numerous ways. Customize its presentation in lists, grids, or graphs, tailoring each aspect to make your dashboard not just informative but also visually captivating.
Connect Your Data Sources
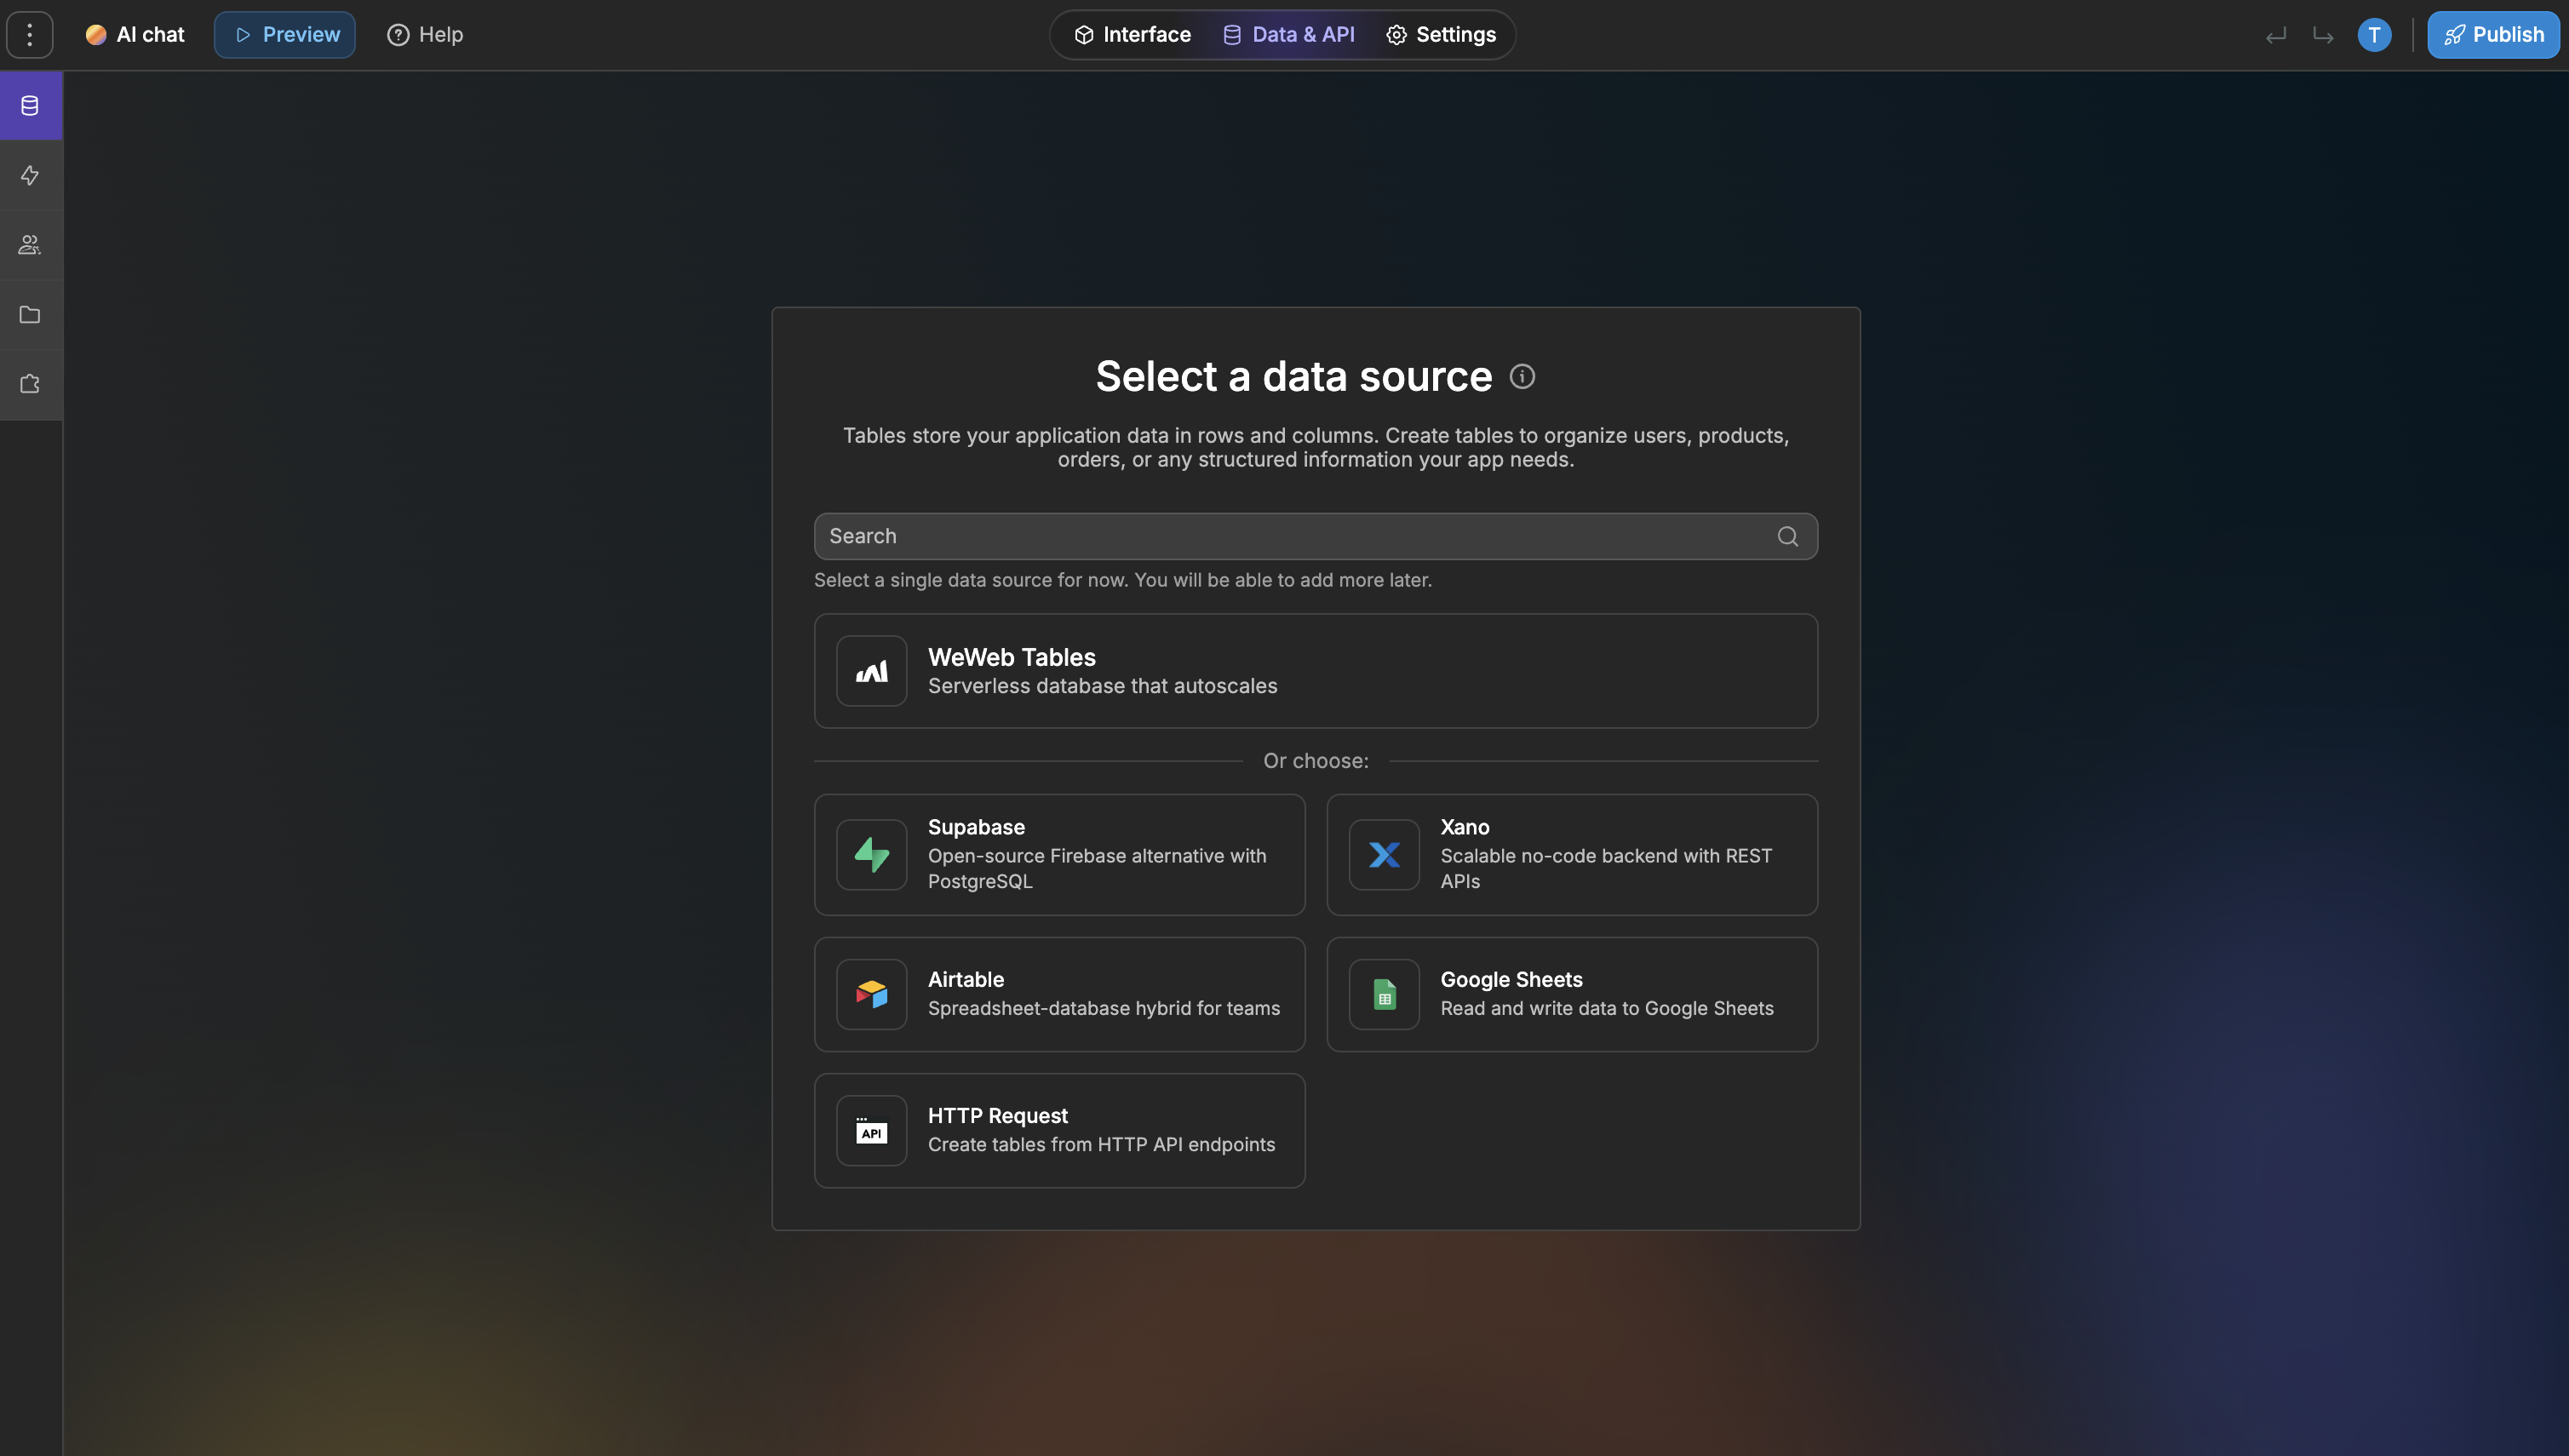
In the Data & API section of the WeWeb Editor, add data sources to fetch data from multiple sources. Think Xano, Supabase, Airtable, API Actors (like Apify, Bright Data) or any service that connects through REST or GraphQL APIs. You can also connect to WeWeb's native backend.
You can add multiple data sources and decide which should display dynamic, static, or cached data.
🔥 Pro tip: in most cases, when building out reactive web-applications, we recommend working with dynamic data. Learn more about when using static or cached data can be beneficial.
Add Authentication and Gate Content
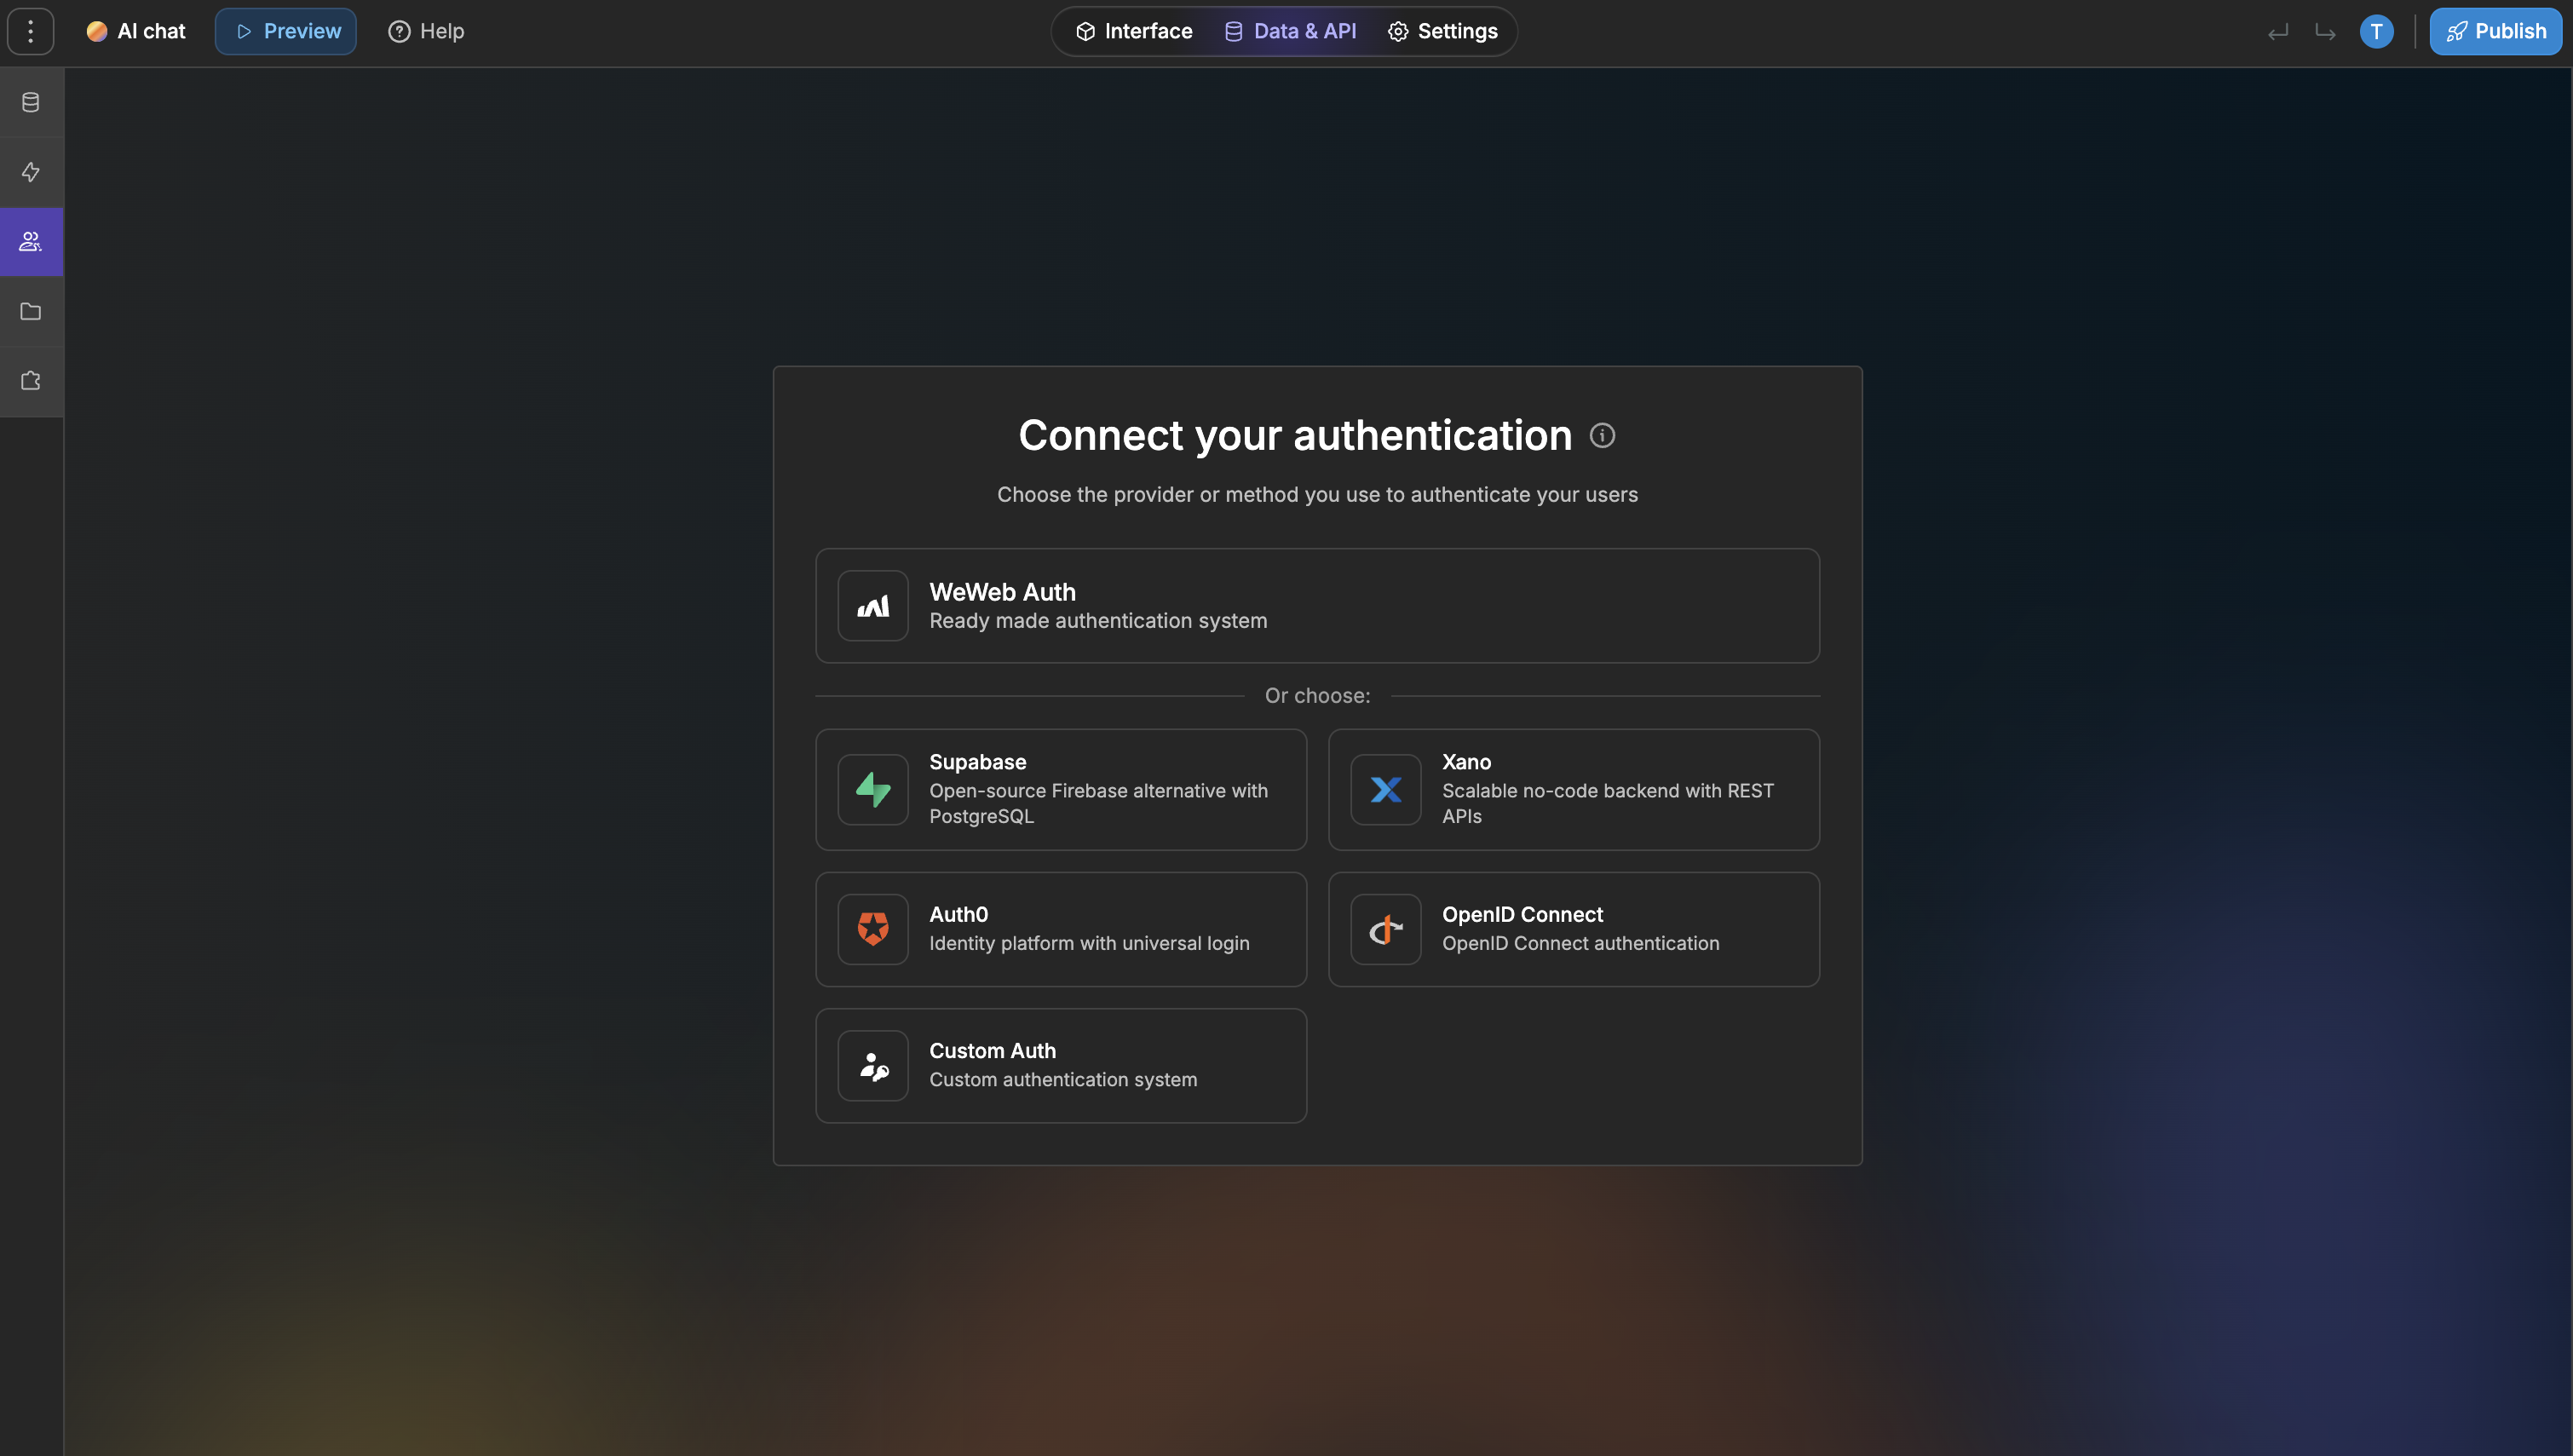
In the Authentication section, you can select and add your preferred authentication provider.
You can use native integrations with WeWeb Auth, Auth0, Xano Auth and Supabase Auth, or use the OpenID and Token Based Auth plugins to connect to other providers or your own custom auth.
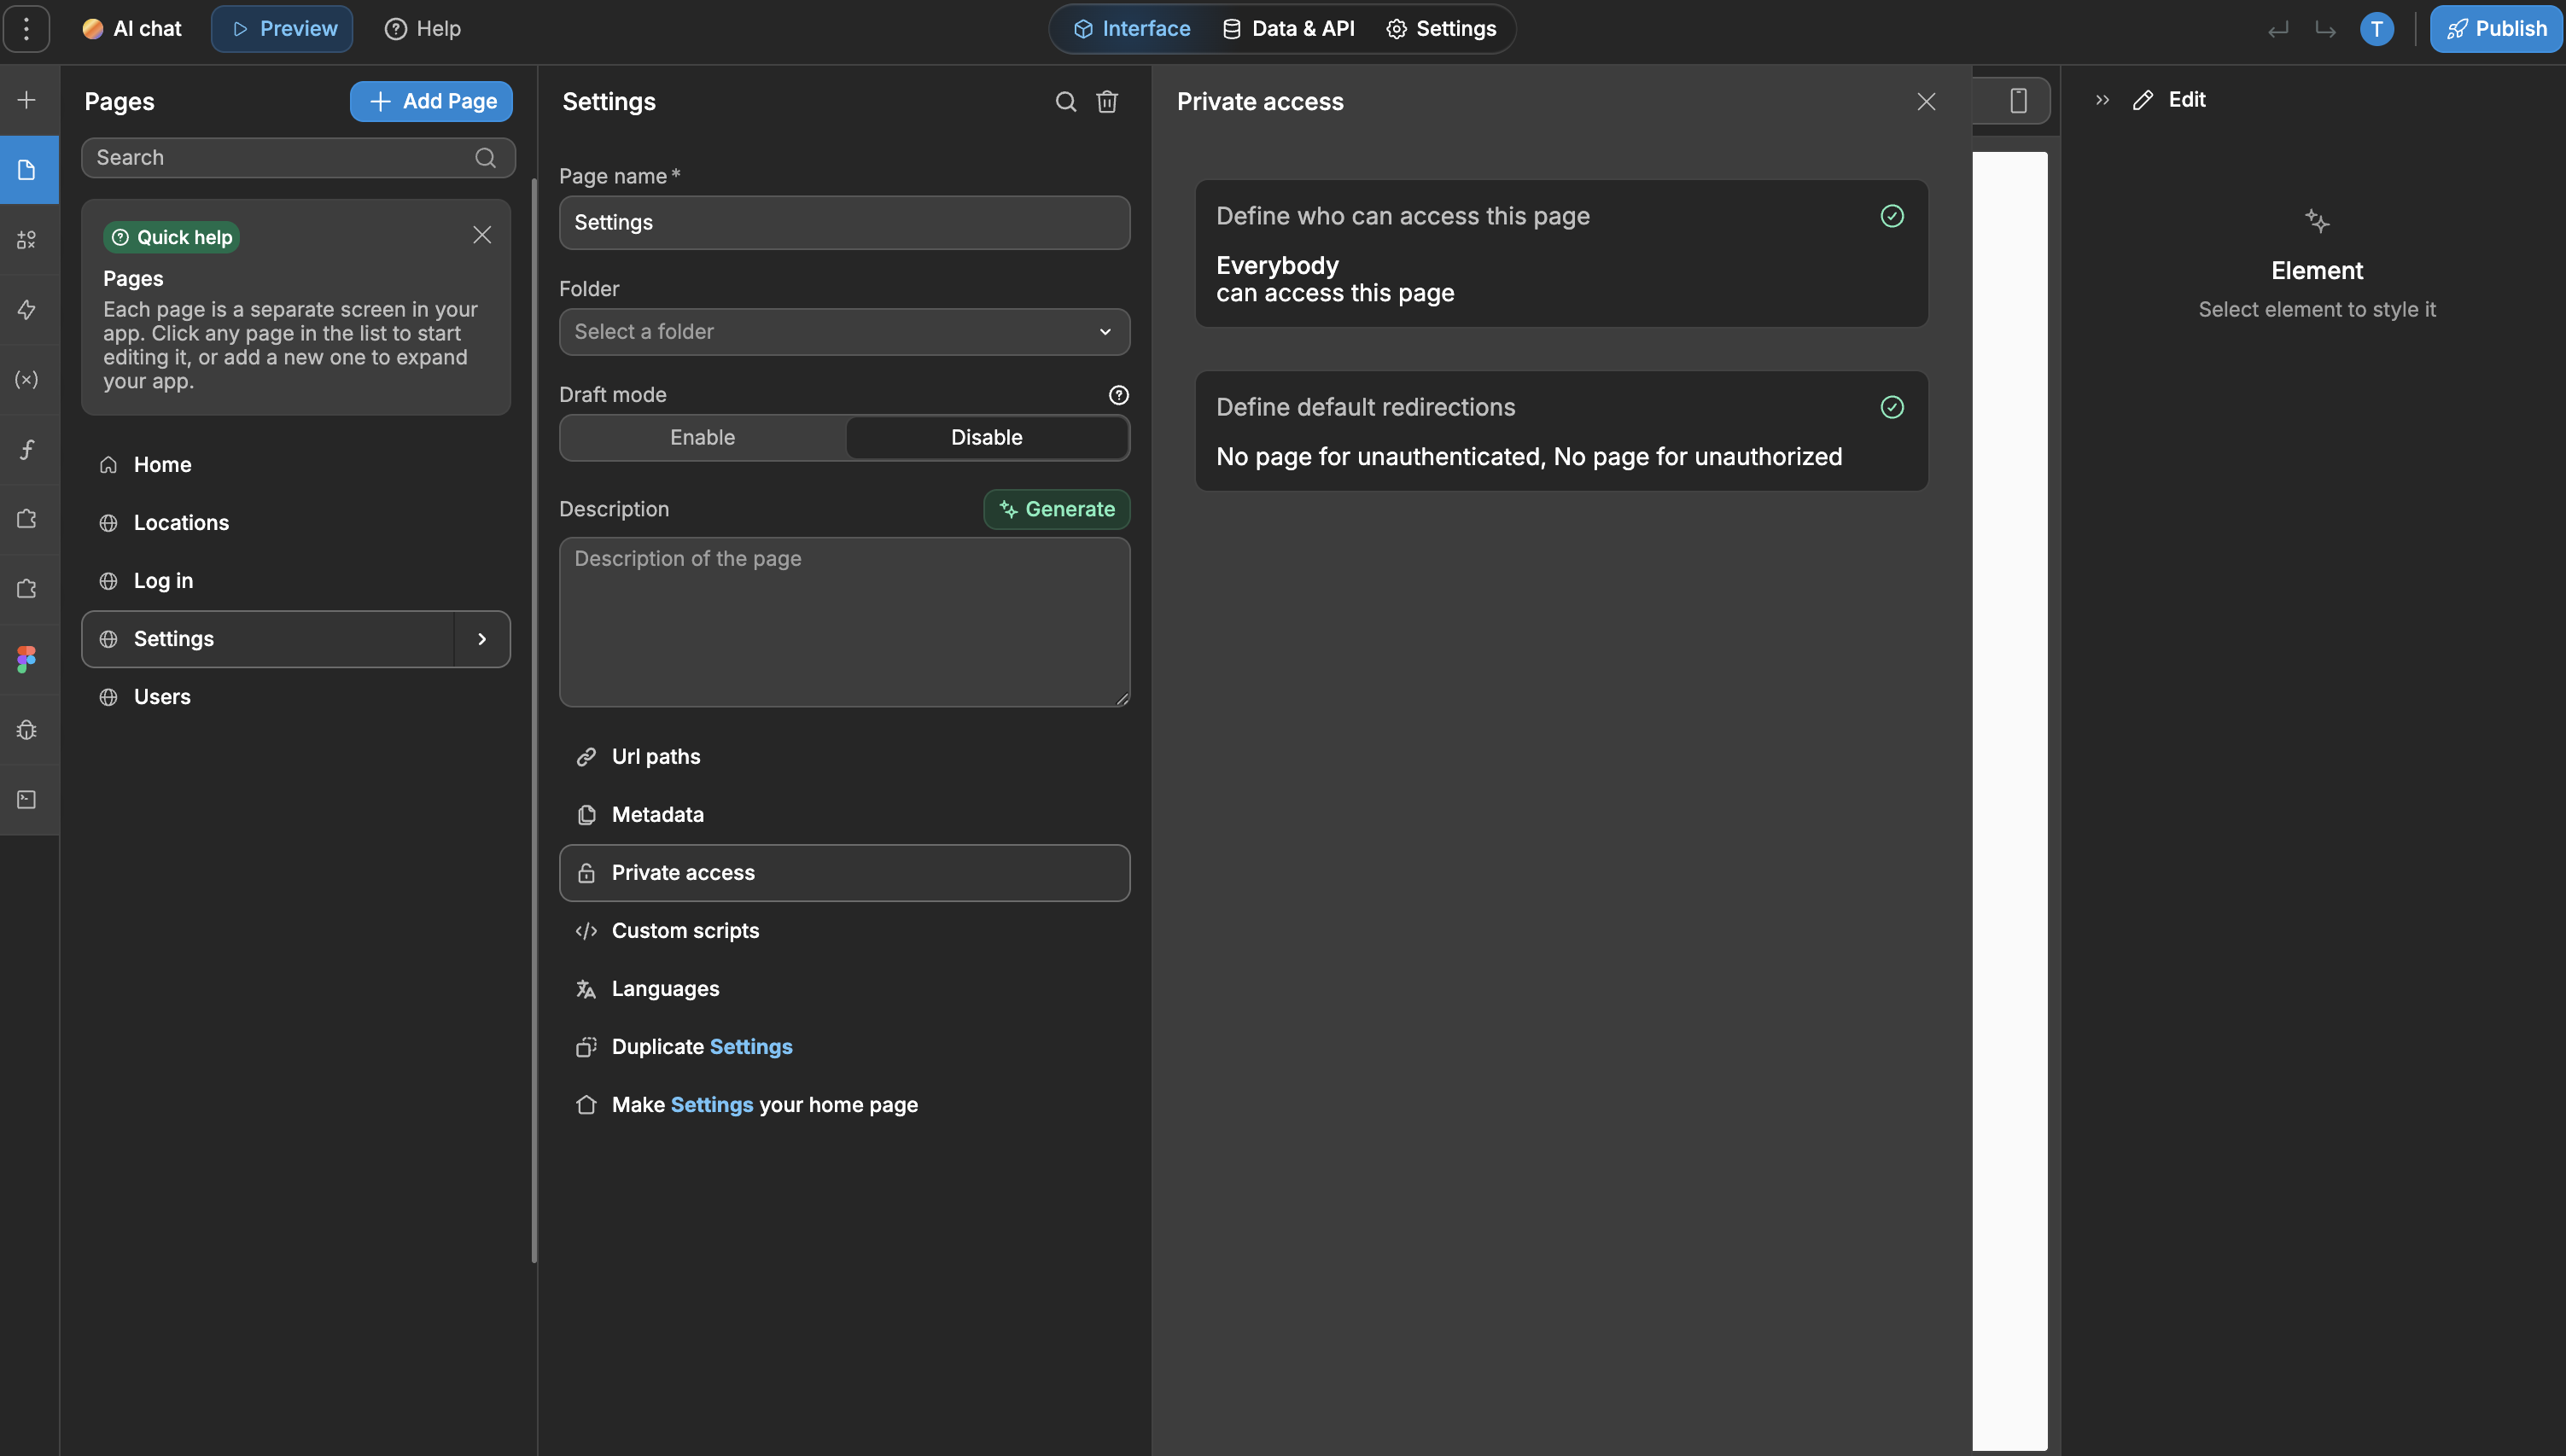
Once you have added and configured authentication to your WeWeb project, you will be able to make pages private so that only authentication users can access them.
For example, a login page should be public, but pages containing sensitive information might require authentication and be restricted to certain user groups.
To adjust these settings, navigate to the Pages section and click ‘>.’ As shown in our example, you can select ‘Private Access‘ and 'Authenticated users.' If you opt for 'Authenticated users,' you can further refine access by selecting ‘+ Add a user group,’ thereby limiting the page to specific users.
🔥 Pro tip: It's important to understand that gating content in the frontend is more of a UX feature than a security measure. In web development, security always happens in the backend. To protect your data, you must secure the API endpoints or tables in your backend, even if the page that triggers those calls is private. Learn more about securing your data.
Publish and Share Your WeWeb Dashboard!
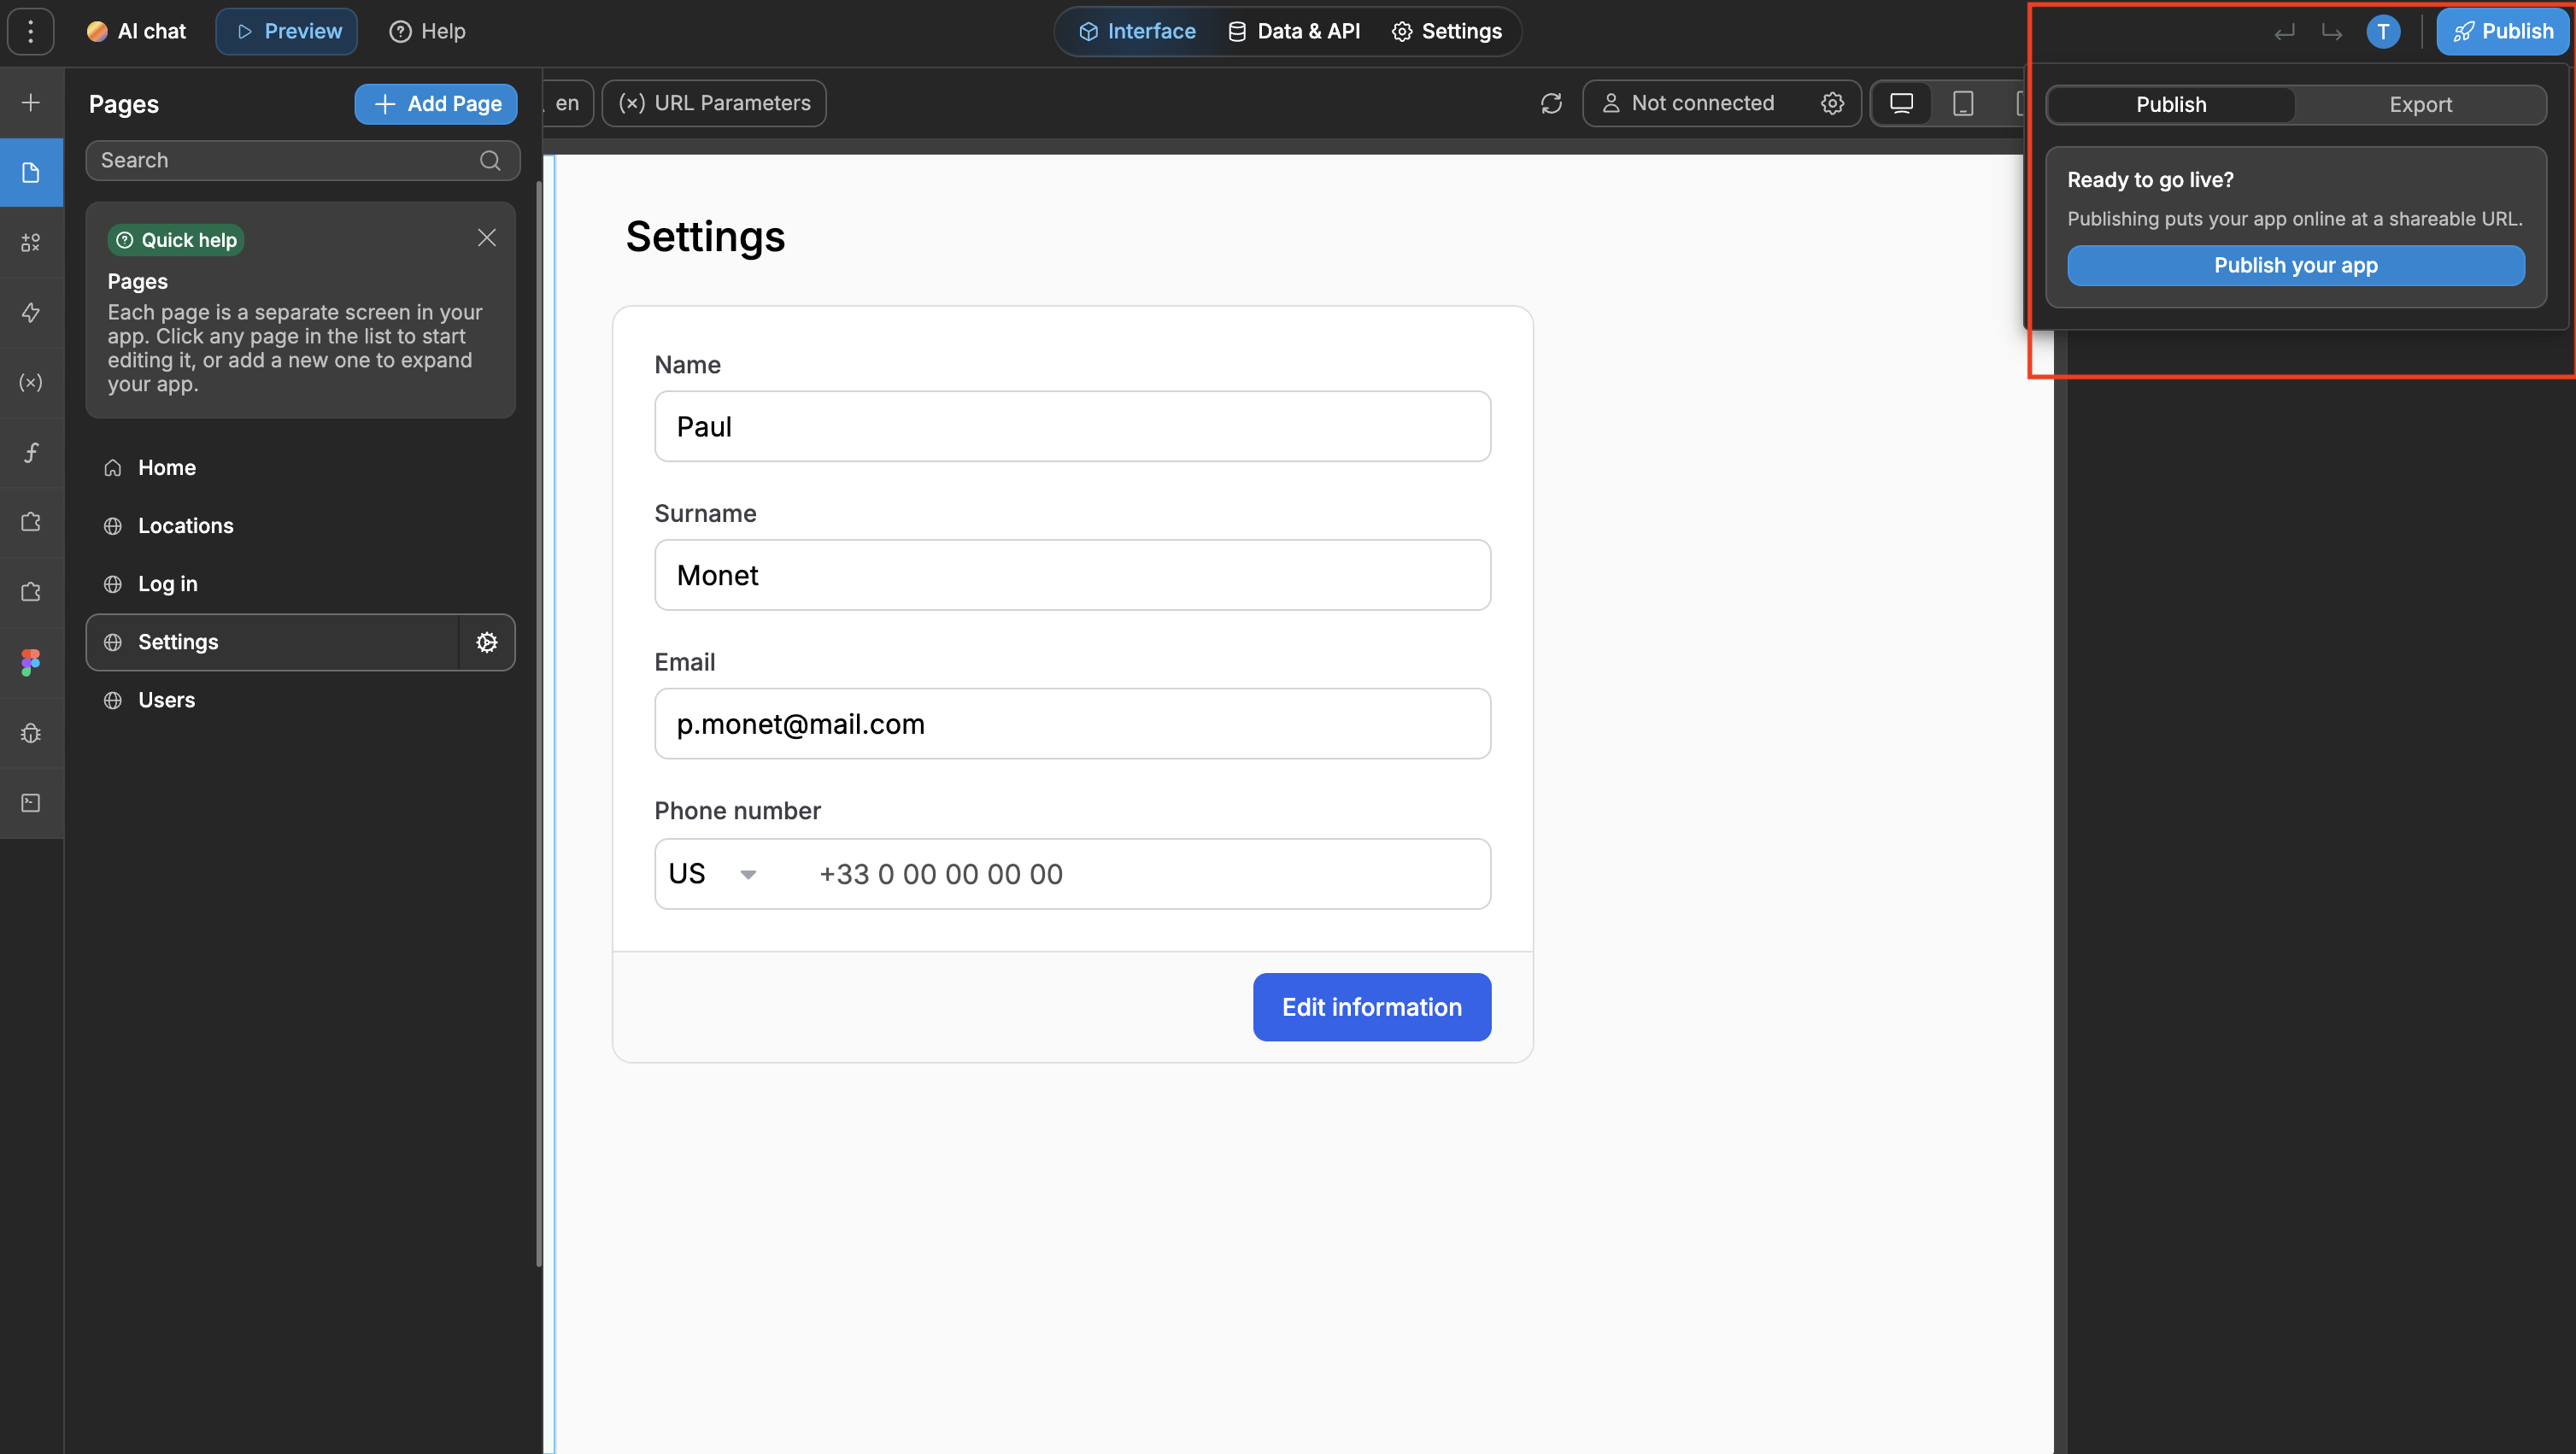
Once you've configured your authentication and privacy settings, your dashboard is all set for publishing. Simply click the 'Publish' button in the top right corner, and then you're ready to share your dashboard with colleagues, stakeholders, or executives.
Building Dashboards With No-Code: Takeaways
Creating a well-organized and easily navigable dashboard has a multitude of benefits. It's not just about presenting data; it's about keeping you and your team synchronized and focused on the most important metrics. A dashboard that's easy to read at a glance can be a powerful tool for alignment and decision-making.
With WeWeb's no-code platform, you have the power to create dashboards that turn complex datasets into visually appealing, easily digestible formats.
You can use a variety of tools like engaging videos, informative tables, and insightful charts to tell a story with your data. This not only makes information easy to understand but also ensures that it's accessible to everyone in your organization.
No-Code Dashboard FAQs
Get answers to your frequently asked questions about no-code dashboards below.
Why do you need a custom dashboard?
A custom dashboard allows you to showcase your data and KPIs in a format that resonates with both you and your team. For instance, you might choose a bar chart to illustrate conversion rates clearly, while a pie chart could be ideal for breaking down website traffic sources.
How hard is it to build a no-code dashboard?
Building a no-code dashboard is accessible to anyone with an appetite to learn, especially when you choose the right platform. WeWeb stands out in this regard. We've designed our no-code dashboard template with a simple interface, allowing you to rearrange and customize elements on your dashboard. This approach ensures that you can tailor your dashboard to your needs without any technical intimidation or complexity.
What are the key components of a typical dashboard?
A well-designed no-code dashboard seamlessly incorporates key metrics using elements such as charts, graphics, and widgets. It's essential to have clear, easy-to-read labels, headings, and abbreviations to facilitate quick understanding. Beyond these basics, you have the flexibility to enhance your dashboard with various plug-ins or extensions like Typeform or Calendly. Additionally, setting up privacy and verification steps ensures your data remains in the right hands and accessible only to authorized users.
Can I integrate multiple views into a single dashboard on WeWeb?
WeWeb offers the flexibility to integrate multiple views on a single page. You can simultaneously display several elements like charts and maps, creating a unified and cohesive dashboard. By showcasing different views, you can craft a comprehensive and multi-dimensional representation of your data in one dashboard.
How can I make my dashboard more interactive?
You can enhance your dashboard's engagement by incorporating interactive features. For instance, you might integrate real-time data charts or use tools like a time interval widget and data filters for a more nuanced understanding of your data. These interactive elements make your dashboard not only more engaging but also more insightful for users.
Ready to build? Grab your template here and let's do this!